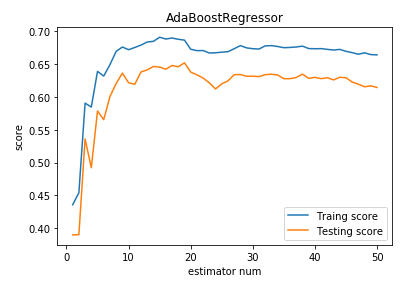
import numpy as np
import matplotlib.pyplot as plt

from sklearn import datasets,ensemble
from sklearn.model_selection import train_test_split

def load_data_classification():
    '''
    加载用于分类问题的数据集
    '''
    # 使用 scikit-learn 自带的 digits 数据集
    digits=datasets.load_digits()
    # 分层采样拆分成训练集和测试集,测试集大小为原始数据集大小的 1/4
    return train_test_split(digits.data,digits.target,test_size=0.25,random_state=0,stratify=digits.target)

#集成学习AdaBoost算法回归模型
def test_AdaBoostRegressor(*data):
    '''
    测试 AdaBoostRegressor 的用法,绘制 AdaBoostRegressor 的预测性能随基础回归器数量的影响
    '''
    X_train,X_test,y_train,y_test=data
    regr=ensemble.AdaBoostRegressor()
    regr.fit(X_train,y_train)
    ## 绘图
    fig=plt.figure()
    ax=fig.add_subplot(1,1,1)
    estimators_num=len(regr.estimators_)
    X=range(1,estimators_num+1)
    ax.plot(list(X),list(regr.staged_score(X_train,y_train)),label="Traing score")
    ax.plot(list(X),list(regr.staged_score(X_test,y_test)),label="Testing score")
    ax.set_xlabel("estimator num")
    ax.set_ylabel("score")
    ax.legend(loc="best")
    ax.set_title("AdaBoostRegressor")
    plt.show()

# 获取分类数据
X_train,X_test,y_train,y_test=load_data_classification()
# 调用 test_AdaBoostRegressor
test_AdaBoostRegressor(X_train,X_test,y_train,y_test)
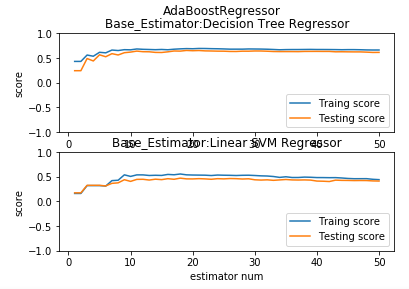
def test_AdaBoostRegressor_base_regr(*data):
    '''
    测试 AdaBoostRegressor 的预测性能随基础回归器数量的和基础回归器类型的影响
    '''
    from sklearn.svm import  LinearSVR

    X_train,X_test,y_train,y_test=data
    fig=plt.figure()
    regrs=[ensemble.AdaBoostRegressor(), # 基础回归器为默认类型
    ensemble.AdaBoostRegressor(base_estimator=LinearSVR(epsilon=0.01,C=100))] # 基础回归器为 LinearSVR
    labels=["Decision Tree Regressor","Linear SVM Regressor"]
    for i ,regr in enumerate(regrs):
        ax=fig.add_subplot(2,1,i+1)
        regr.fit(X_train,y_train)
        ## 绘图
        estimators_num=len(regr.estimators_)
        X=range(1,estimators_num+1)
        ax.plot(list(X),list(regr.staged_score(X_train,y_train)),label="Traing score")
        ax.plot(list(X),list(regr.staged_score(X_test,y_test)),label="Testing score")
        ax.set_xlabel("estimator num")
        ax.set_ylabel("score")
        ax.legend(loc="lower right")
        ax.set_ylim(-1,1)
        ax.set_title("Base_Estimator:%s"%labels[i])
    plt.suptitle("AdaBoostRegressor")
    plt.show()

# 调用 test_AdaBoostRegressor_base_regr
test_AdaBoostRegressor_base_regr(X_train,X_test,y_train,y_test)
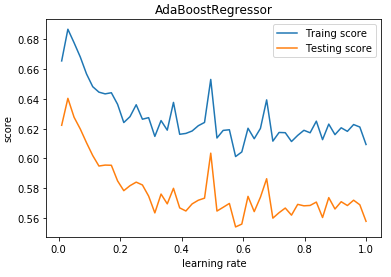
def test_AdaBoostRegressor_learning_rate(*data):
    '''
    测试 AdaBoostRegressor 的预测性能随学习率的影响
    '''
    X_train,X_test,y_train,y_test=data
    learning_rates=np.linspace(0.01,1)
    fig=plt.figure()
    ax=fig.add_subplot(1,1,1)
    traing_scores=[]
    testing_scores=[]
    for learning_rate in learning_rates:
        regr=ensemble.AdaBoostRegressor(learning_rate=learning_rate,n_estimators=500)
        regr.fit(X_train,y_train)
        traing_scores.append(regr.score(X_train,y_train))
        testing_scores.append(regr.score(X_test,y_test))
    ax.plot(learning_rates,traing_scores,label="Traing score")
    ax.plot(learning_rates,testing_scores,label="Testing score")
    ax.set_xlabel("learning rate")
    ax.set_ylabel("score")
    ax.legend(loc="best")
    ax.set_title("AdaBoostRegressor")
    plt.show()

# 调用 test_AdaBoostRegressor_learning_rate
test_AdaBoostRegressor_learning_rate(X_train,X_test,y_train,y_test)
def test_AdaBoostRegressor_loss(*data):
    '''
    测试 AdaBoostRegressor 的预测性能随损失函数类型的影响
    '''
    X_train,X_test,y_train,y_test=data
    losses=['linear','square','exponential']
    fig=plt.figure()
    ax=fig.add_subplot(1,1,1)
    for i ,loss in enumerate(losses):
        regr=ensemble.AdaBoostRegressor(loss=loss,n_estimators=30)
        regr.fit(X_train,y_train)
        ## 绘图
        estimators_num=len(regr.estimators_)
        X=range(1,estimators_num+1)
        ax.plot(list(X),list(regr.staged_score(X_train,y_train)),label="Traing score:loss=%s"%loss)
        ax.plot(list(X),list(regr.staged_score(X_test,y_test)),label="Testing score:loss=%s"%loss)
        ax.set_xlabel("estimator num")
        ax.set_ylabel("score")
        ax.legend(loc="lower right")
        ax.set_ylim(-1,1)
    plt.suptitle("AdaBoostRegressor")
    plt.show()

# 调用 test_AdaBoostRegressor_loss
test_AdaBoostRegressor_loss(X_train,X_test,y_train,y_test)
