import numpy as np
import matplotlib.pyplot as plt

from sklearn import  cluster
from sklearn.metrics import adjusted_rand_score
from sklearn.datasets.samples_generator import make_blobs

def create_data(centers,num=100,std=0.7):
    X, labels_true = make_blobs(n_samples=num, centers=centers, cluster_std=std)
    return  X,labels_true

#层次聚类AgglomerativeClustering模型
def test_AgglomerativeClustering(*data):
    '''
    测试 AgglomerativeClustering 的用法
    '''
    X,labels_true=data
    clst=cluster.AgglomerativeClustering()
    predicted_labels=clst.fit_predict(X)
    print("ARI:%s"% adjusted_rand_score(labels_true,predicted_labels))

# 用于产生聚类的中心点
centers=[[1,1],[2,2],[1,2],[10,20]]
# 产生用于聚类的数据集
X,labels_true=create_data(centers,1000,0.5)
#  调用 test_AgglomerativeClustering 函数
test_AgglomerativeClustering(X,labels_true)
def test_AgglomerativeClustering_nclusters(*data):
    '''
    测试 AgglomerativeClustering 的聚类结果随 n_clusters 参数的影响
    '''
    X,labels_true=data
    nums=range(1,50)
    ARIs=[]
    for num in nums:
        clst=cluster.AgglomerativeClustering(n_clusters=num)
        predicted_labels=clst.fit_predict(X)
        ARIs.append(adjusted_rand_score(labels_true,predicted_labels))
    ## 绘图
    fig=plt.figure()
    ax=fig.add_subplot(1,1,1)
    ax.plot(nums,ARIs,marker="+")
    ax.set_xlabel("n_clusters")
    ax.set_ylabel("ARI")
    fig.suptitle("AgglomerativeClustering")
    plt.show()

#  调用 test_AgglomerativeClustering_nclusters 函数
test_AgglomerativeClustering_nclusters(X,labels_true)

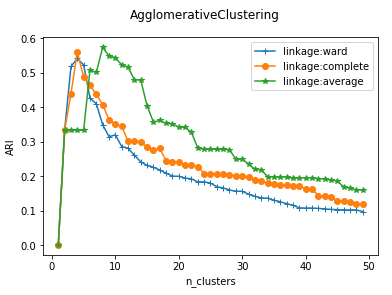
def test_AgglomerativeClustering_linkage(*data):
    '''
    测试 AgglomerativeClustering 的聚类结果随链接方式的影响
    '''
    X,labels_true=data
    nums=range(1,50)
    fig=plt.figure()
    ax=fig.add_subplot(1,1,1)

    linkages=['ward','complete','average']
    markers="+o*"
    for i, linkage in enumerate(linkages):
        ARIs=[]
        for num in nums:
            clst=cluster.AgglomerativeClustering(n_clusters=num,linkage=linkage)
            predicted_labels=clst.fit_predict(X)
            ARIs.append(adjusted_rand_score(labels_true,predicted_labels))
        ax.plot(nums,ARIs,marker=markers[i],label="linkage:%s"%linkage)

    ax.set_xlabel("n_clusters")
    ax.set_ylabel("ARI")
    ax.legend(loc="best")
    fig.suptitle("AgglomerativeClustering")
    plt.show()

#  调用 test_AgglomerativeClustering_linkage 函数
test_AgglomerativeClustering_linkage(X,labels_true)