参考链接:
https://mp.weixin.qq.com/s?__biz=MzI5MDUyMDIxNA==&mid=2247514888&idx=2&sn=3884cf50b88eaee6744d35cb528c0fa7&chksm=ec1c56f1db6bdfe7585830d13a3673648c1b9f5098af15d53e4efb96e16a1b22003b1b56ba43&mpshare=1&scene=1&srcid=1103IwBjWjTF3h8l3Smh5ohu&sharer_sharetime=1604478585079&sharer_shareid=3839dc73cba9ba6f5a6eb2fee58f300f&key=966b233910e1aa6df0e367067aa3169852053729d9052e5342c78c9521b069153beb74b5e5136bf692087ad3f33b8e74113962a2cb47ef61279a45edfb79e1a1f8e2a1f99ffb03b137b906f25ce6b92abd156e73faa83b558301cfaf0612deeca4803458512fba340ae9f489ef073cf96c4031c2bd491bf7f53d3a58c3d2cc62&ascene=1&uin=MjAyMjA0NjY3MA%3D%3D&devicetype=Windows+10+x64&version=6300002f&lang=zh_CN&exportkey=AwmXeExcmzVZ1BaQZJvCJ3o%3D&pass_ticket=jMBlpDzYyeU7%2BXpQJxN0X6ddKC13bpbPaoJh%2FjGTz2GR%2BAB4Bu7Rui39ieh3Oxic&wx_header=0
https://blog.csdn.net/bigbennyguo/article/details/87956434
https://blog.csdn.net/zouxiaolv/article/details/105192739
https://pytorch.apachecn.org/docs/1.2/tensorboard.html
https://gist.github.com/anonymous/bf16430f7750c023141c562f3e9f2a91
https://github.com/lanpa/tensorboardX/blob/master/README.md
https://blog.csdn.net/goldxwang/article/details/76855200 Matplotlib调用imshow()函数绘制热图
首先进行环境的配置
我的基本环境:ubuntu 16 py3.6

安装对应的tensorboard tensorboard X ,还有tensorflow-gpu
具体的方法可参考本文开头的第一篇链接
如果出现
启动Tensorboard时发生错误:class BeholderHook(tf.estimator.SessionRunHook): AttributeError: module 'tensorflow.python.estimator.estimator_lib' has no attribute 'SessionRunHook'
主要原因是tensorflow 和tensorboard的版本不一致(要做到上面截图红线所示)
如果出现
cl@gxz:~/visual$ python test.py
[W common_gpu.cc:35] Insufficient cuda driver. Cannot use cuda.
这是因为cuda 和torch 的版本不对应,具体可参考https://www.cnblogs.com/tingtin/p/13900424.html
具体实现过程:
1.
代码:
from tensorboardX import SummaryWriter

# Creates writer1 object.
# The log will be saved in 'runs/exp'
writer1 = SummaryWriter('runs/exp1')


for i in range(10):
    writer1.add_scalar('quadratic', i**2, global_step=i)
    writer1.add_scalar('exponential', 2**i, global_step=i)
需要先运行代码,生成

2.命令行执行:tensorboard --logdir=<your_log_dir> #这里需要注意your_log_dir 为
writer1 = SummaryWriter('runs/exp1')
此时的tensorboard --logdir='runs/exp1'
来开启tensorboard

3.那么现在可以在浏览器地址栏输入相应地址
如果是服务器需要服务器地址+端口号 ,如:http://192.1.27.110:6006/
如果输入相关地址后没反应,可以参考 https://blog.csdn.net/index20001/article/details/82871634
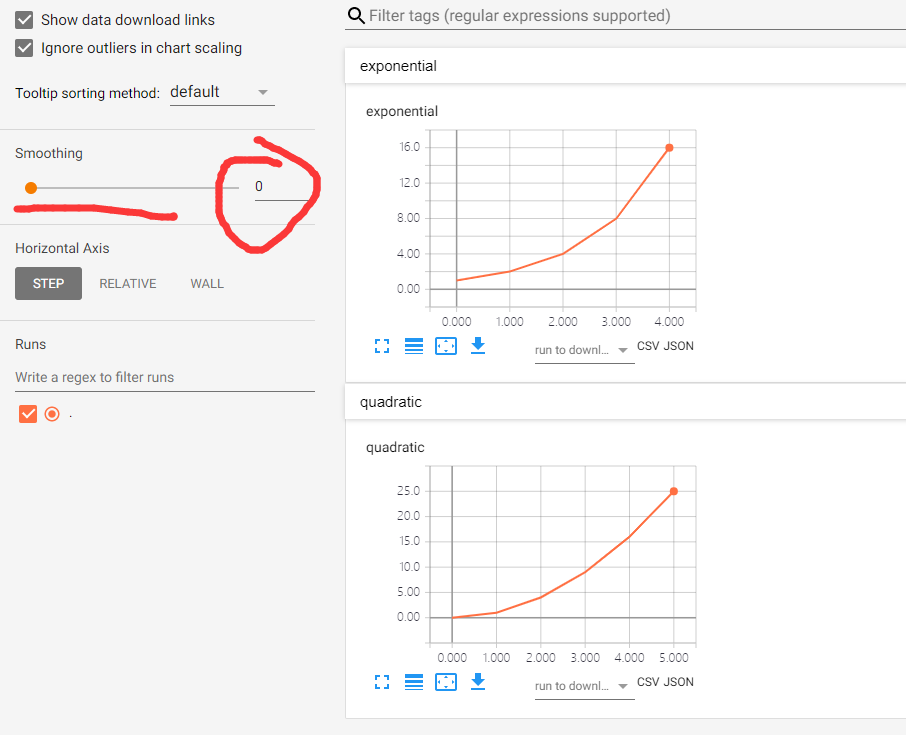
注意:这里的 Smoothing =0 ,不然会在一幅图上显示2条曲线
很容易发现上图没有对应的label,也就是希望下图的

要实现上图,可以在windows环境下
前提:已经得到数据,然后用曲线表示
import requests
import bs4
import re
import time
import xlwt
import xlrd
import telnetlib
import urllib
import matplotlib
# matplotlib.use('Agg')
from bs4 import BeautifulSoup
from urllib import request
from urllib.request import urlopen
# from tensorboardX import SummaryWriter
# from my_fake_useragent import UserAgent
import matplotlib.pyplot as plt
import matplotlib as mpl
import numpy as np
xlsx_path='.psnr+60.xlsx'
data_xsls = xlrd.open_workbook(xlsx_path)
sheet_name = data_xsls.sheets()[0]
count_nrows = sheet_name.nrows  #获取总行数
x1 = []
x2 = []
x3= []
y1 =[]
y2 = []
y3 = []
for i in range(1,count_nrows):
    y1.append(sheet_name.cell(i,1).value)  #根据行数来取对应列的值,并添加到字典中
    y2.append(sheet_name.cell(i, 2).value)
    y3.append(sheet_name.cell(i, 3).value)
    x1.append(i)
    x2.append(i)
    x3.append(i)


plt.figure()
plt.plot(x1, y1, color='red', label='middlebury')
plt.plot(x2, y2, color='black', label='KITTI2012')
plt.plot(x3, y3, color='blue', label='KITTI2015')

plt.xlabel('Steps',fontsize=20)
plt.ylabel('PSNR',fontsize=20)
plt.legend(fontsize=16)
plt.show()
但是add_iamge() 能够接受的格式是[C,H,W], 范围[0,1],C<=4,数据类型tensor.FloatTensor。
以一副图展示C张图片
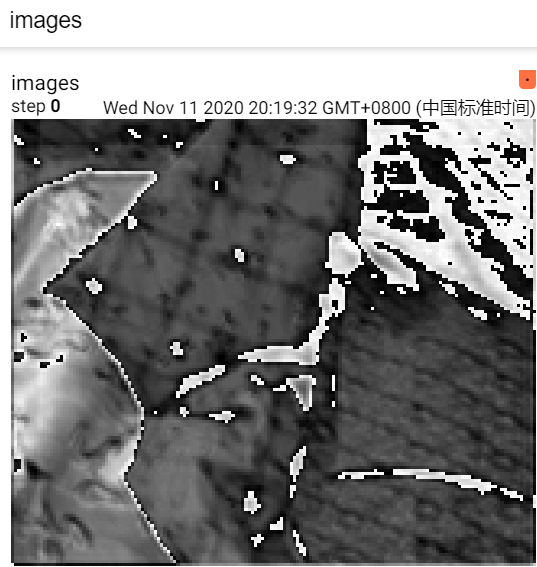
#多通道特征图可视化
        # print(' buffer_left:size', buffer_left.shape)
        # print(' buffer_right:size', buffer_right.shape)#[B,C,H,W]
        # print(' buffer_left[0]:size', buffer_left[0].shape)#[C,H,W],#buffer_left[0]像素点范围不是[0,1]
        # y =  buffer_left[0].detach().cpu().unsqueeze(dim=1)#[C,1,H,W]
        # print(' buffer_left[0]:size', buffer_left[0].shape)
        # print(' y:size', y.shape)#一般为[C,1,H,W]
        # a, _,c ,d= buffer_left.shape
        #
        #
        # #buffer_left[0] 才可以,也就是[1,H,W]才没有歧义
        # grid = torchvision.utils.make_grid( y, normalize=True, scale_each=True)
        # print('grid.size :', grid.size())#grid一定要三维,grid的像素点值范围[0,1]
        # # writer.add_image('images',grid , 0,dataformats='CHW')
        # writer.add_image('images',y[31], 0, dataformats='CHW')#这是第32张特征图
        # writer.close()

第32张特征图
把网络某环节的特征图以热图形式可视化
每个通道一张热力图
参考博客:https://blog.csdn.net/GrayOnDream/article/details/99090247
#下面是某卷积部分,
init_feature维特征提取网络
buffer_left = self.init_feature(x_left)#[B,C,H,W]
buffer_right = self.init_feature(x_right)

        l = buffer_left[0].shape[0]#通道数目
        dst = './feautures'
        therd_size = 256#有些图太小,会放大到这个尺寸
        def make_dirs(path):
            if os.path.exists(path) is False:
                os.makedirs(path)
        dst_path = os.path.join(dst)
        make_dirs(dst_path)
        for i in range(l):
            y =np.asarray(buffer_left[0].data.cpu())#处理成array格式
            y_ = y[i, :, :]
            print('y_.shape:', y_.shape)#2维
            print('y_type:',y_.dtype)#float32
            y_ = np.asarray(y_ * 255, dtype=np.uint8)#[0,255]
            print('y_type:', y_.dtype)#uint8
            # y_ = cv2.applyColorMap(y_, cv2.COLORMAP_JET)
            y_ = cv2.applyColorMap(y_, cv2.COLORMAP_RAINBOW)#https://www.sohu.com/a/343215045_120197868创建伪彩色
            if y_.shape[0] < therd_size:#大小调整
                tmp_file = os.path.join(dst_path, str(i) + '_' + str(therd_size) + '.png')
                tmp_img = y_.copy()#将src中的元素复制到tensor
                tmp_img = cv2.resize(tmp_img, (therd_size, therd_size), interpolation=cv2.INTER_NEAREST)#https://www.cnblogs.com/jyxbk/p/7651241.html
                cv2.imwrite(tmp_file, tmp_img)
            dst_file = os.path.join(dst_path, str(i) + '.png')
            cv2.imwrite(dst_file, y_)
多个通道融合为一张热力图
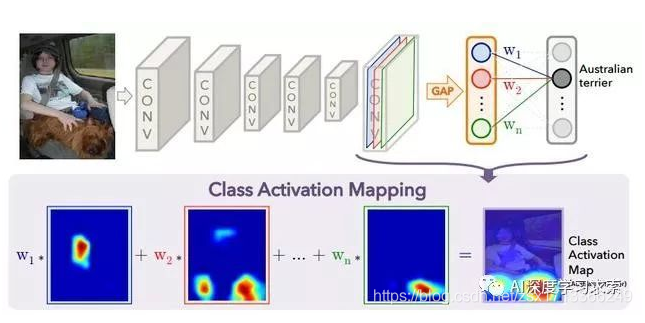
每个通道有一个权重,该通道的权重就是特征图的均值
            [c, h, w] = out[0].shape
            # print('buffer_left[0]',buffer_left[0].shape)
            # print('c h  w',c,h,w)
            ans = np.zeros((h, w))
            dst = './feautures'
            therd_size = 256  # 有些图太小,会放大到这个尺寸
            dst_path = os.path.join(dst)
            make_dirs(dst_path)
            ret = []
            y = np.asarray(out[0].data.cpu())  # 处理成array格式
            for i in range(c):
                y_ = y[i, :, :]
                ret.append(np.mean(y_))#把每个feature map的均值作为对应权重
            for j in range(h):
                for k in range(w):
                    for i in range(c):
                        ans[j][k] += ret[i] * y[i][j][k]#融合
            for i in range(h):
                for j in range(w):
                    ans[i][j] = max(0, ans[i][j])#不需要负值
            ans = (ans - np.min(ans)) / np.max(ans)#归一化
            print('ans
', ans)
            ans = np.asarray(ans * 255, dtype=np.uint8)  # [0,255]
            print('ans _type:', ans.dtype)  # uint8
            # y_ = cv2.applyColorMap(y_, cv2.COLORMAP_JET)
            ans = cv2.applyColorMap(ans, cv2.COLORMAP_JET)  # https://www.sohu.com/a/343215045_120197868创建伪彩色
            if ans.shape[0] < therd_size:  # 大小调整
                tmp_file = os.path.join(dst_path, str(therd_size) + 'sr.png')
                tmp_img = ans.copy()  # 将src中的元素复制到tensor
                tmp_img = cv2.resize(tmp_img, (therd_size, therd_size),
                                     interpolation=cv2.INTER_NEAREST)  # https://www.cnblogs.com/jyxbk/p/7651241.html
                cv2.imwrite(tmp_file, tmp_img)
            dst_file = os.path.join(dst_path, 'sr.png')
            cv2.imwrite(dst_file, ans)
            return out

注意如果

ERROR: TensorBoard could not bind to port 6006, it was already in use
表示目前的端口正在被使用,需要lsof -i:6006
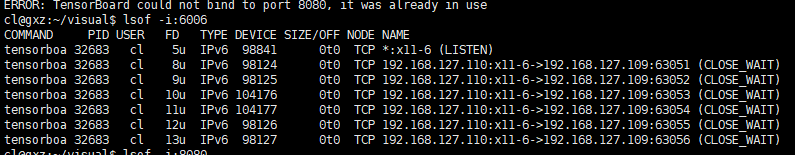
kill -9 32683
在重新在浏览器输入地址+端口才可,不要用其他的端口,不然会无法显示曲线
上述解决方案来源于 https://blog.csdn.net/c20081052/article/details/81974847
如果第二次运行tensorboard时发现不显示图像,只有一个点(此时的gxz文件可能比正常的小)
那可能是上一次没有writer.close()
调用日志书写器实例对象summary_writer的close()方法写入内存,否则它每隔120s写入一次
close() 方法是把事件文件写到硬盘,并且关闭文件,一般是在不再需要writer的时候调用这个函数。
如果
add_image() got an unexpected keyword argument 'dataformats'
请
pip install tensorboardX==1.6
如果遇到:
No dashboards are active for the current data set.
请参考:https://www.cnblogs.com/ipersevere/p/10843115.html