测试验证环境
数据: 7w+ 条,数据结构如下图:
> head(car.train)
   DV    DC     RV   RC   SOC   HV   LV HT LT                                 Type TypeName
1 379 85.09   0.00  0.0 62.99 3.99 0.00 12  0 10f689e8-e6cc-47a3-be5a-dbc3833428ef    EV200
2 379 85.09 370.89 59.9 63.99 4.01 0.00 12  0 10f689e8-e6cc-47a3-be5a-dbc3833428ef    EV200
3 379 85.09   0.00  0.0 64.99 4.01 0.00 12  0 10f689e8-e6cc-47a3-be5a-dbc3833428ef    EV200
4 379 85.09   0.00  0.0 66.00 4.03 1.55 12 11 10f689e8-e6cc-47a3-be5a-dbc3833428ef    EV200
5 379 85.09   0.00  0.0 67.00 4.03 0.00 12  0 10f689e8-e6cc-47a3-be5a-dbc3833428ef    EV200
6 379 85.09   0.00  0.0 68.00 4.05 0.00 13  0 10f689e8-e6cc-47a3-be5a-dbc3833428ef    EV200
机器配置:

R version:
> version
               _
platform       x86_64-w64-mingw32
arch           x86_64
os             mingw32
system         x86_64, mingw32
status
major          3
minor          2.5
year           2016
month          04
day            14
svn rev        70478
language       R
version.string R version 3.2.5 (2016-04-14)
nickname       Very, Very Secure Dishes
R包性能对比
全局函数及参数设置


##----------------------全局设置-------------------------------
remove(list=ls())
space_path <- c("E:\RScore\kmeans\")
setwd(space_path)
Sys.setlocale(category = "LC_ALL",local="chinese")

##table 行列转换函数
tblView <- function (tbl)
{
  ##install.packages("tidyr")
  library(tidyr)
  df <- as.data.frame(tbl)
  df <- spread(data = df, key = Var2, value = Freq)
  datatable(df)
}

## 公共函数:数据读写及计算
source("core.R",encoding="utf-8")
teld.ml.init()

##训练样本
car.train <- teld.ml.rQuery("D_Cluster")
newdata <- car.train[1:8]
stats::kmeans
source code:
> ################################################stats::kmeans######################################
> startTime <- Sys.time();
>
> library(stats)
> kc <- kmeans(x=newdata, centers = 13)
> #plot(newdata[,c("DV","DC")],col=kc$cluster)
> tbl <- table(car.train$TypeName,kc$cluster)
> tblView(tbl)
>
> ##耗时间
> endTime <- Sys.time()
> difTime <- difftime(endTime,startTime,units = "secs")
> print(paste0("stats::kmeans total time:", difTime))
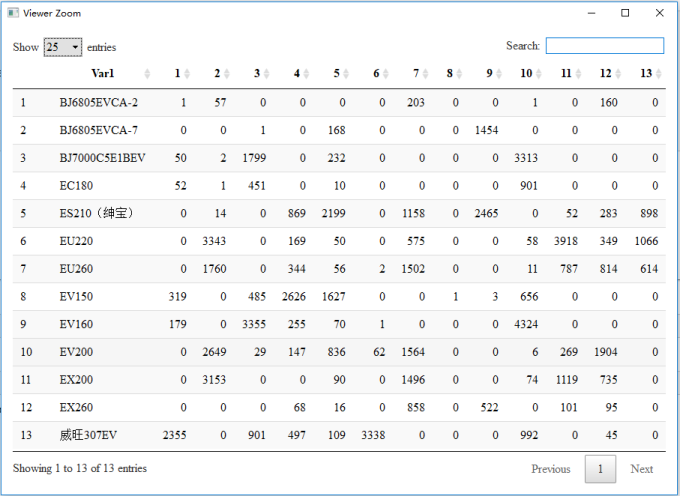
[1] "stats::kmeans total time:0.195545196533203"
stats::kmeans total time:0.195545196533203, result view:
fpc::kmeansruns
source code:
> ################################################fpc::kmeansruns######################################
> startTime <- Sys.time();
>
> library(fpc)
> kc1 <- kmeansruns(data = newdata,krange = 1:15,critout = TRUE)
2 clusters 9394.437
3 clusters 185919.7
4 clusters 482630.4
5 clusters 414875.3
6 clusters 376338
7 clusters 334493.6
8 clusters 303976.7
9 clusters 279036.3
10 clusters 432009.9
11 clusters 363074.8
12 clusters 405784.7
13 clusters 397422.8
14 clusters 371842.5
15 clusters 408561.7
Warning messages:
1: Quick-TRANSfer stage steps exceeded maximum (= 3507150)
2: Quick-TRANSfer stage steps exceeded maximum (= 3507150)
3: Quick-TRANSfer stage steps exceeded maximum (= 3507150)
> tbl<- table(car.train$TypeName,kc1$cluster)
> tblView(tbl)
>
> ##耗时间
> endTime <- Sys.time()
> difTime <- difftime(endTime,startTime,units = "secs")
> print(paste0("fpc::kmeansruns total time:", difTime))
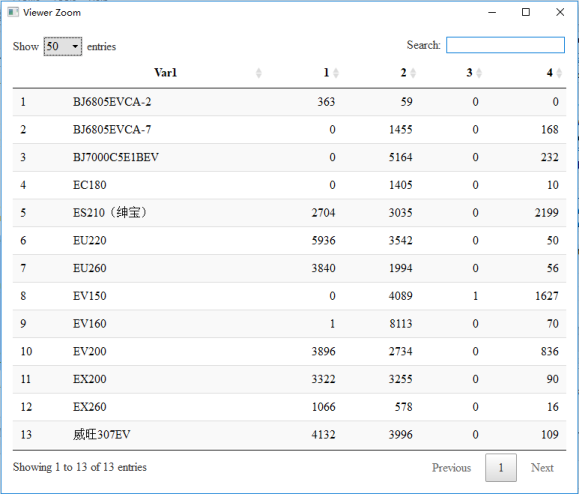
[1] "fpc::kmeansruns total time:107.454074859619"
[1] "fpc::kmeansruns total time:107.454074859619" result view:
cluster::pam
source code
> ################################################cluster::pam######################################
>
> library(cluster)
> cPam <- pam(x=newdata,k=13)
Error in pam(x = newdata, k = 13) :
  have 70143 observations, but not more than 65536 are allowed
Error: 待确认
fpc::pamk
source code
> ################################################fpc::pamk######################################
>
> library(fpc)
> fPamk <- pamk(newdata,krang=1:15)
Error in pam(sdata, k, diss = diss, ...) :
  have 70143 observations, but not more than 65536 are allowed
Error: 待确认
stats::hclust
source code:
################################################fpc::pamk######################################
>
> library(fpc)
> fPamk <- pamk(newdata,krang=1:15)
Error in pam(sdata, k, diss = diss, ...) :
  have 70143 observations, but not more than 65536 are allowe
Error: 待确认
mclust::Mclust
source code:
> ################################################mclust::Mclust######################################
> library(mclust)
> EM<-Mclust(newdata)
Error in hcVVV(data = c(379, 379, 379, 379, 379, 379, 379, 379, 379, 379,  :
  NAs in foreign function call (arg 13)
In addition: Warning message:
In hcVVV(data = c(379, 379, 379, 379, 379, 379, 379, 379, 379, 379,  :
  NAs introduced by coercion to integer range
Error: 待确认
cluster::fanny
source code:
> ################################################cluster::fanny######################################
> library(cluster)
> fannyz=fanny(newdata,13,metric="SqEuclidean")
Error in fanny(newdata, 13, metric = "SqEuclidean") :
  long vectors (argument 5) are not supported in .Fortran
Error: 待确认
e1071::cmeans
source code:
> ################################################e1071::cmeans######################################
> startTime <- Sys.time();
>
> library("e1071")
> eCm<-cmeans(newdata,15)
> tbl <- table(car.train$TypeName,eCm$cluster)
> tblView(tbl)
>
> ##耗时间
> endTime <- Sys.time()
> difTime <- difftime(endTime,startTime,units = "secs")
> print(paste0("stats::kmeans total time:", difTime))
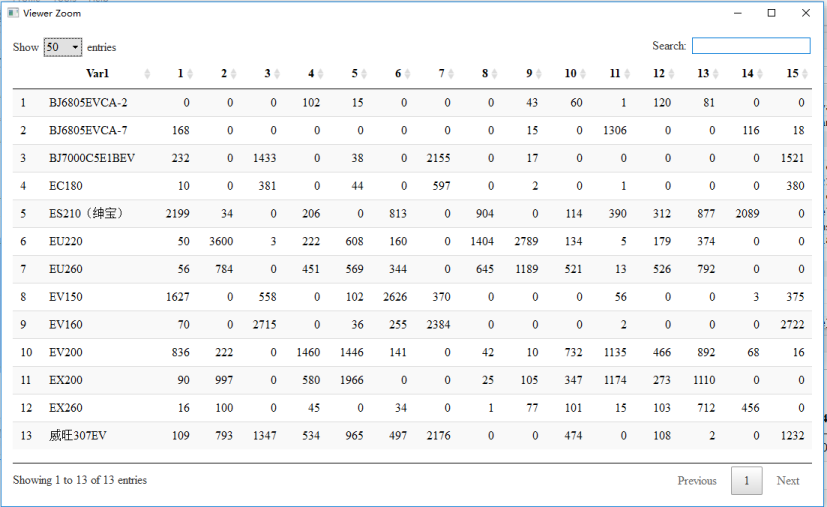
[1] "stats::kmeans total time:8.7237401008606"
[1] "stats::kmeans total time:8.7237401008606" result view:
待验证