目录:
- 数学函数
- 统计函数
- 应用示例
- 控制流
数学函数
- ceiling(x): 大于等于 x 的最小整数, 如: ceiling(3.213) --> 4
- floor(x): 小于等于 x 的最大整数,如: floor(3.6534) --> 3
- trunc(x): 取x的整数部分, 如: trunc(5.999) --> 5
- round(x,digits=n): 将x舍入为指定的小数, 如: round(3.4567,2) --> 3.46
- signif(x,digits=n): 将x舍入为指定的有效数字位数 如: signif(3.4567,2) --> 3.5
统计函数
- 算术平均数: 直接将一组数据的各个数值相加除以数值个数,计算公式为:

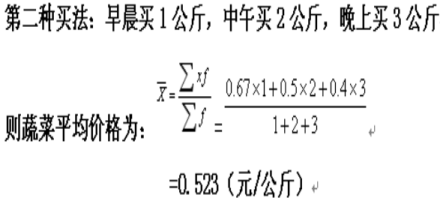
- 加权算术平均值:根据分组变量值出现的次数或频数为权数计算均数,公式如下:

- x1 为各组组中值(假定值)、f1为每组数据出现的频次,如下示例图,

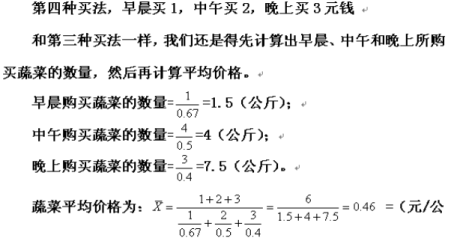
- 调和平均值:是各个变量值倒数的算术平均数的倒数,习惯用H表示,它通常作为算术平均数的变形使用的,也就是同于受所掌握的资料限制,有时不能直接采用算术平均数的,这就需要使用调和平均数的形式进行计算,公式如下:

- 示例:如早、中、晚菜价格分别是0.67,0.5,0.4 公斤/元,计算不同方式平均价

统计函数
- mean(x): 平均数,语法: mean(x, trim = 0, na.rm = FALSE, ...)
- trim: (0 to 0.5), 如:mean(x, trim = 0.1), 表示先把x的最大的10%的数和最小的10%的数去掉,然后剩下的数算平均
- 示例代码
 x <- c(2,4,6,8,10,11)
 mean(x,trim = 0.2)   #6*0.2=1.2(取整),除去最大最小值11、2 ,实际计算 4 6 8 10的平均 --> 7
 mean(x)              # 41/6  --> 6.833
- median(x) : 中位数,语法: median(x, na.rm = FALSE) ,从小到大或是从大到小排列时最中间的那个或是最中间两个数的平均值,主要用于算一个整体(小组)的一般水平...
> x <- c(2,4,6,9,10,11)
>  median(x)
[1] 7.5
>  x <- c(2,4,9,10,11)
>  median(x)
[1] 9
- med(x): 绝对中位数,语法:mad(x, center = median(x), constant = 1.4826, na.rm = FALSE,low = FALSE, high = FALSE)
- 主要是考虑到数据列中一些与均值相差较远的离谱数据在求均值和方差时候,尤其是求方差时对结果产生较大的影响
- 实际上计算mad的过程就是:constant * cMedian(abs(x - center))
- low,high: 当中位数是两个数字时,根据设置的参数取最小或最大的值
- 示例代码
> x <- c(1,2,3,5,7,8)
> mad(x)
[1] 3.7065
> #分解mad(x)计算过程
> y <- abs(x - median(x));y
[1] 3 2 1 1 3 4
> z <- median(y);z
[1] 2.5
> 1.4826 * z
[1] 3.7065
- 众数:指变量数列中出现次数最多的变量值, R中未提供计算众数的函数,则自定义函数来实现,思路如下:
> x <- c(2,4,6,9,9,11)
> names(table(x))[which.max(table(x))]
[1] "9"
> max(table(x))
[1] 2
- rang(x): 求值域, 语法:range(..., na.rm = FALSE)
> x <- c(1,2,3,5,7,8)
> y <- range(x);y
[1] 1 8
> diff(y)   #滞后差分
[1] 7
- sd(x): 标准差,语法:sd(x, na.rm = FALSE), 标准差是一组数据平均值分散程度的一种度量。一个较大的标准差,代表大部分数值和其平均值之间差异较大;一个较小的标准差,代表这些数值较接近平均值
- 标准差也被称为标准偏差,或者实验标准差,公式为
 , ,
, , - 公式意义:所有数减去其平均值的平方和,所得结果除以该组数之个数减一 (上面的公式有误),再把所得值开根号,所得之数就是这组数据的标准差
- 标准差应用于投资上,可作为量度回报稳定性的指标。标准差数值越大,代表回报远离过去平均数值,回报较不稳定故风险越高。相反,标准差数值越小,代表回报较为稳定,风险亦较小
- 代码示例:
> x <- c(1,2,3,4)
> sd(x)
[1] 1.290994
> m <- mean(x);
> y <- sum((x - m)^2)/(length(x) -1)
> sqrt(y)
[1] 1.290994
-
scale(x): 为数据对象x按列进行中心化或标准化,语法:scale(x, center = TRUE, scale = TRUE)
- 数据的中心化是指数据集中的各项数据减去数据集的均值
- 标准化是指中心化之后的数据在除以数据集的标准差
- 示例代码:
> data <- c(1, 2, 3, 6, 3)
> scale(data)
           [,1]
[1,] -1.0690450
[2,] -0.5345225
[3,]  0.0000000
[4,]  1.6035675
[5,]  0.0000000
attr(,"scaled:center")
[1] 3
attr(,"scaled:scale")
[1] 1.870829
- quantile(x): 求百分位数,语法:quantile(x, probs = seq(0, 1, 0.25), na.rm = FALSE, names = TRUE,...)
- 默认计算方法:要计算的点到起始点的距离/终点到起始点的距离=要计算的比例
- 示例代码:
> m <- c(1:20)
> quantile(m,probs = c(0.25,0.75,1));
  25%   75%  100%
 5.75 15.25 20.00
> (20 -1)*0.25 + 1
[1] 5.75
应用示例
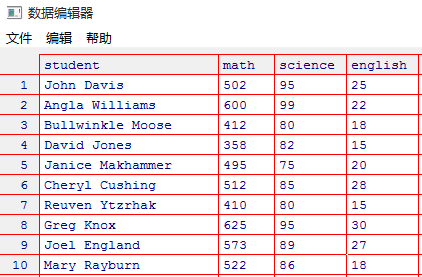
- 根据如下表格中的数据,按成绩对学生进行ABCDEF分等级,最后按姓氏和名字进行排序输出
- 示例数据如下,保存本地 student.rda 文件中
- 第一步: 同于三门学科分值相差甚远,首选必须将变量进行标准化,让数据变得可比较, 每科成绩用单位标准差表示,如下
> setwd("E:\R")
> load(file = "roster.rda")
> options(digits = 2)  #小数点后保留2位
> z <- scale(roster[,2:4])
> z
     math science english
1   0.013   1.078   0.587
2   1.143   1.591   0.037
3  -1.026  -0.847  -0.697
4  -1.649  -0.590  -1.247
5  -0.068  -1.489  -0.330
6   0.128  -0.205   1.137
7  -1.049  -0.847  -1.247
8   1.432   1.078   1.504
9   0.832   0.308   0.954
10  0.243  -0.077  -0.697
-
第二步:计算每行的平均得分获得综合得分,合并到花名册,如下:
> score <- apply(z,MARGIN = 1,FUN = mean); > score 1 2 3 4 5 6 7 8 9 10 0.56 0.92 -0.86 -1.16 -0.63 0.35 -1.05 1.34 0.70 -0.18 > roster <- cbind(roster,score);roster student math science english score 1 John Davis 502 95 25 0.56 2 Angla Williams 600 99 22 0.92 3 Bullwinkle Moose 412 80 18 -0.86 4 David Jones 358 82 15 -1.16 5 Janice Makhammer 495 75 20 -0.63 6 Cheryl Cushing 512 85 28 0.35 7 Reuven Ytzrhak 410 80 15 -1.05 8 Greg Knox 625 95 30 1.34 9 Joel England 573 89 27 0.70 10 Mary Rayburn 522 86 18 -0.18 -
第三步:按百分位数进行等级划分,如下:
> y <- quantile(roster$score,probs = c(0.8,0.6,0.4,0.2)) > y 80% 60% 40% 20% 0.74 0.44 -0.36 -0.89 > roster <- within(roster,{ + grader <- NA + grader[score >= y[1]] <- "A" + grader[score < y[1] & score >= y[2]] <- "B" + grader[score < y[2] & score >= y[3]] <- "C" + grader[score < y[3] & score >= y[4]] <- "D" + grader[score < y[4]] <- "E" + }) > roster student math science english score grader 1 John Davis 502 95 25 0.56 B 2 Angla Williams 600 99 22 0.92 A 3 Bullwinkle Moose 412 80 18 -0.86 D 4 David Jones 358 82 15 -1.16 E 5 Janice Makhammer 495 75 20 -0.63 D 6 Cheryl Cushing 512 85 28 0.35 C 7 Reuven Ytzrhak 410 80 15 -1.05 E 8 Greg Knox 625 95 30 1.34 A 9 Joel England 573 89 27 0.70 B 10 Mary Rayburn 522 86 18 -0.18 C -
第四步: 将student变量拆分为firstname 和 lastname ,并按姓氏和名称排序,将结果保存为本地文件 studentGrade.rda
> name <- strsplit(roster$student," ") Error in strsplit(roster$student, " ") : non-character argument > class(roster$student) #查看student类型,是因子,必须转化成字符 [1] "factor" -
正确代码如下:
>  name  <- strsplit(as.character(roster$student)," ")
>  firstname <- sapply(name,"[",1)  # "[" 是一个可以提取某个对象一部分的函数,在这里用来提取列表中name各成份中的第一或二个元素
>  lastname <- sapply(name,"[",2)
>  sGrade <- cbind(firstname,lastname,roster[,-1])
>  sGrade[order(sGrade$lastname),]
    firstname  lastname math science english      score grader
6      Cheryl   Cushing  512      85      28  0.3532485      C
1        John     Davis  502      95      25  0.5592028      B
9        Joel   England  573      89      27  0.6978361      B
4       David     Jones  358      82      15 -1.1620473      E
8        Greg      Knox  625      95      30  1.3378934      A
5      Janice Makhammer  495      75      20 -0.6289776      D
3  Bullwinkle     Moose  412      80      18 -0.8565414      D
10       Mary   Rayburn  522      86      18 -0.1768163      C
2       Angla  Williams  600      99      22  0.9238259      A
7      Reuven   Ytzrhak  410      80      15 -1.0476242      E
>  save(sGrade,file = "studentGrade.rda")
控制流
- for : 示例: for(i in 1:10) print("hello")
- while: 示例:
 i<-10
 while (i>0)
 {
   print("hello")
   i <- i-1
 }
- ifelse: 语法: ifelse(cond,statement1,statement2) , 当 cond = true 时执行第一个语句,反之执行第二个
- swith: 语法: switch(expression, case1, case2, case3....)
x <- switch(
  3,
  "first",
  "second",
  "third",
  "fourth"
)
x