• Echarts横坐标倾斜,顶部显示数字


    最近项目使用到Echarts,所以学习了下

    根据API,实现Echarts很简单,在这就不多说了,下面就说说项目中碰到的一些需求

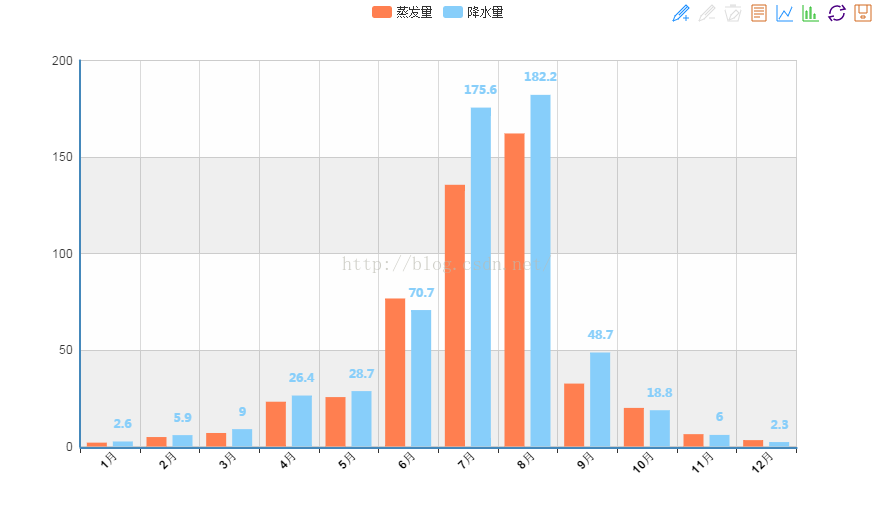
    1.由于横坐标很多,导致数据不能展示完整,所以需要设置横坐标样式倾斜展示

    2.每个数据列(比如柱形图),顶部需要显示具体数值

    [html] view plain copy
     
    1. <!DOCTYPE html>  
    2. <html lang="en">  
    3. <head>  
    4. <meta charset="utf-8">  
    5. <meta http-equiv="X-UA-Compatible" content="IE=edge">  
    6. <meta name="viewport" content="width=device-width, initial-scale=1.0">  
    7. <meta name="description" content="ECharts">  
    8. <title>Echarts横坐标倾斜,顶部文字显示实现</title>  
    9. <script type="text/javascript" src="http://apps.bdimg.com/libs/jquery/2.1.4/jquery.min.js"></script>  
    10. </head>  
    11. <script type="text/javascript">  
    12.     var width;  
    13.     var height;  
    14.     var myChart;  
    15.     $(function(){  
    16.         //自适应设置  
    17.         width = $(window).width();  
    18.         height = $(window).height();  
    19.         $("#mainBar").css("width",width-40);  
    20.         $("#mainBar").css("height",height-40);  
    21.         console.log(height);  
    22.         setEcharts();  
    23.     });  
    24.       
    25.     $(window).resize(function() {  
    26.         width = $(window).width();  
    27.         height = $(window).height();  
    28.         $("#mainBar").css("width",width-40);  
    29.         $("#mainBar").css("height",height-40);  
    30.     });   
    31.       
    32.     function setEcharts(){  
    33.         myChart = echarts.init(document.getElementById('mainBar'));  
    34.         //自适应  
    35.         window.onresize = myChart.resize;  
    36.         myChart.setOption({  
    37.             tooltip : {  
    38.                 trigger: 'axis'  
    39.             },  
    40.             legend: {  
    41.                 data:['蒸发量','降水量']  
    42.             },  
    43.             toolbox: {  
    44.                 show : true,  
    45.                 feature : {  
    46.                     mark : {show: true},  
    47.                     dataView : {show: true, readOnly: false},  
    48.                     magicType : {show: true, type: ['line', 'bar']},  
    49.                     restore : {show: true},  
    50.                     saveAsImage : {show: true}  
    51.                 }  
    52.             },  
    53.             calculable : true,  
    54.             xAxis : [  
    55.                 {  
    56.                     type : 'category',  
    57.                     data : ['1月','2月','3月','4月','5月','6月','7月','8月','9月','10月','11月','12月'],  
    58.                     //设置字体倾斜  
    59.                     axisLabel:{  
    60.                         interval:0,  
    61.                         rotate:45,//倾斜度 -90 至 90 默认为0  
    62.                         margin:2,  
    63.                         textStyle:{  
    64.                             fontWeight:"bolder",  
    65.                             color:"#000000"  
    66.                         }  
    67.                     },    
    68.                 }  
    69.             ],  
    70.             yAxis : [  
    71.                 {  
    72.                     type : 'value',  
    73.                     splitArea : {show : true}  
    74.                 }  
    75.             ],  
    76.             series : [  
    77.                 {  
    78.                     name:'蒸发量',  
    79.                     type:'bar',  
    80.                     data:[2.0, 4.9, 7.0, 23.2, 25.6, 76.7, 135.6, 162.2, 32.6, 20.0, 6.4, 3.3]  
    81.                 },  
    82.                 {  
    83.                     name:'降水量',  
    84.                     type:'bar',  
    85.                     data:[2.6, 5.9, 9.0, 26.4, 28.7, 70.7, 175.6, 182.2, 48.7, 18.8, 6.0, 2.3],  
    86.                     //顶部数字展示pzr  
    87.                     itemStyle: {  
    88.                         normal: {  
    89.                             label: {  
    90.                                 show: true,//是否展示  
    91.                                 textStyle: {  
    92.                                     fontWeight:'bolder',  
    93.                                     fontSize : '12',  
    94.                                     fontFamily : '微软雅黑',  
    95.                                 }  
    96.                             }  
    97.                         }  
    98.                     },  
    99.                 }  
    100.             ]  
    101.         });  
    102.     }  
    103.       
    104.       
    105. </script>  
    106.   
    107.   
    108.   
    109. <body>  
    110.     <div id="mainBar" style="border:1px solid #ccc;padding:10px;"></div>  
    111.     <!-- 标签式引入Eharts 如果你把引用echarts的script标签放置head内在IE8-的浏览器中会出现报错,解决的办法就是把标签移动到body内(后)。 -->  
    112.     <script type="text/javascript" src="http://apps.bdimg.com/libs/echarts/2.1.9/source/echarts-all.js"></script>  
    113.     <script>  
    114.     </script>  
    115. </body>  
    116. </html>  

    效果图如下:

    还有一个地方可以看到效果图,很不错的一个网站

    效果演示

  • 相关阅读:
    linux_java_同时启动三个项目脚本
    Python 项目-飞机大战_02.飞机大战-2
    Python 项目-飞机大战_01.飞机大战-1
    Mysql为什么要使用视图?
    Python语法基础_10.加强练习
    Python语法基础_09.面向对象3、异常、模块
    crontab--设置周期性被执行的指令
    面试者应向公司问什么问题?
    简单的触发黑名单阻断演示 control+c
    SetConsoleCtrlHandler演示
  • 原文地址:https://www.cnblogs.com/telwanggs/p/8521156.html
Copyright © 2020-2023  润新知