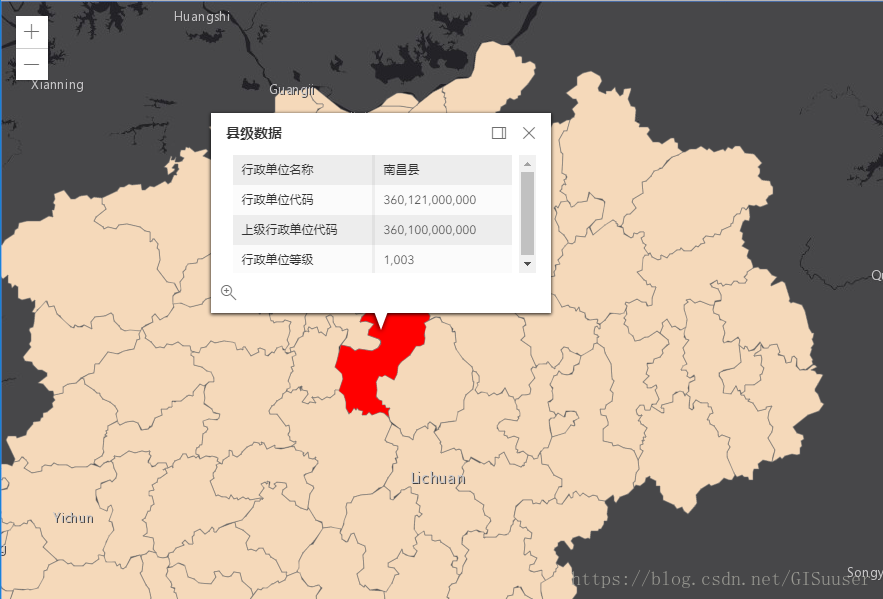
我加载的是ArcGIS Server本地发布的FeatureService,ArcGIS API for JS4.7记载FeatureLayer时,在二维需要通过代码启用WebGL渲染,在三维模式下,则不需要。不启用WebGL,则无法显示进行高亮显示。我在二维模式下,高亮接口是没有生效,因此,二维模式下,自己写了一个高亮,三维还是用的自带的高亮。
二维模式代码:
<!DOCTYPE html>
<html lang="en">
<head>
<meta charset="UTF-8">
<title>要素服务</title>
<link type="text/css" rel="stylesheet" href="http://localhost/arcgis/esri/css/main.css"/>
<link type="text/css" rel="stylesheet" href="css/index.css"/>
<script>
//高亮显示只能在WebGL渲染时才能生效,该功能目前处于beta阶段
var dojoConfig = {
has: {
"esri-featurelayer-webgl": 1
}
}
</script>
<script src="http://localhost/arcgis/"></script>
</head>
<body>
<div id="viewDiv"></div>
<script>
require(["esri/Map", "esri/views/MapView", "esri/config", "esri/layers/FeatureLayer", "dojo/domReady"], function (Map, MapView, esriConfig, FeatureLayer) {
esriConfig.request.corsEnabledServers.push("localhost:6443");//设置地图服务器已允许跨域
esriConfig.request.corsEnabledServers.push("localhost:63342");
var map = new Map({
// basemap: "streets"//ESRI提供的底 图
basemap: "dark-gray"
});
//二维视图,并初始化视图位置
var view = new MapView({
container: "viewDiv",
map: map,
extent: {
xmin: 111.27418783887504,
ymin: 27.65361115167269,
xmax: 119.18589568326072,
ymax: 30.663629324047992,
spatialReference: 4326
}
});
//乡镇级属性模版
var popupTemplate = {
title: "乡镇数据",
content: [{
type: "fields",
fieldInfos: [{
fieldName: "name",
label: "行政单位名称",
format: {
places: 0,
digitSeparator: true
}
}, {
fieldName: "code",
label: "行政单位代码",
format: {
places: 0,
digitSeparator: true
}
}, {
fieldName: "supercode",
label: "上级行政单位代码",
format: {
places: 0,
digitSeparator: true
}
}, {
fieldName: "level",
label: "行政单位等级",
format: {
places: 0,
digitSeparator: true
}
}]
}]
};
var town = new FeatureLayer({
url: "https://localhost:6443/arcgis/rest/services/jiangxi/FeatureServer/0",
outFields: ["*"],
popupTemplate: popupTemplate
});//乡镇级数据
popupTemplate.title = "县级数据";
var county = new FeatureLayer({
url: "https://localhost:6443/arcgis/rest/services/jiangxi/FeatureServer/1",
outFields: ["*"],
popupTemplate: popupTemplate
});//县级数据
popupTemplate.title = "市级数据";
var city = new FeatureLayer({
url: "https://localhost:6443/arcgis/rest/services/jiangxi/FeatureServer/2",
outFields: ["*"],
popupTemplate: popupTemplate
});//市级数据
popupTemplate.title = "省级数据";
var province = new FeatureLayer({
url: "https://localhost:6443/arcgis/rest/services/jiangxi/FeatureServer/3",
outFields: ["*"],
popupTemplate: popupTemplate
});//省级数据
map.add(town);
map.add(county);
map.add(city);
map.add(province);
//点击视窗进行碰撞检测,检测点击的目标graphic
view.on("click", function (evt) {
view.hitTest(evt).then(function (response) {
var result = response.results[0];
if (result && result.graphic) {
console.log(result);
var graphic = result.graphic;
//自定义高亮
//这里的几何图形是面状,配置graphic的symbol为fillSymbol
graphic.symbol = {
type: "simple-fill",
color: "red",
outline: {
color: [128, 128, 128, 0.5],
"0.5px"
}
};
view.graphics.removeAll();//清除上一次点击目标
view.graphics.add(graphic);//添加新的点击目标
}
})
});
})
</script>
</body>
</html>
二维模式效果图:

三维模式代码:
<!DOCTYPE html>
<html lang="en">
<head>
<meta charset="UTF-8">
<title>要素服务</title>
<link type="text/css" rel="stylesheet" href="http://localhost/arcgis/esri/css/main.css"/>
<link type="text/css" rel="stylesheet" href="css/index.css"/>
<script src="http://localhost/arcgis/init.js"></script>
</head>
<body>
<div id="viewDiv"></div>
<script>
require(["esri/Map", "esri/views/SceneView", "esri/config", "esri/layers/FeatureLayer", "dojo/domReady"], function (Map, SceneView, esriConfig, FeatureLayer) {
esriConfig.request.corsEnabledServers.push("localhost:6443");//设置地图服务器已允许跨域
esriConfig.request.corsEnabledServers.push("localhost:63342");
var map = new Map({
basemap: "dark-gray"
});
//二维视图,并初始化视图位置
var view = new SceneView({
container: "viewDiv",
map: map,
extent: {
xmin: 111.27418783887504,
ymin: 27.65361115167269,
xmax: 119.18589568326072,
ymax: 30.663629324047992,
spatialReference: 4326
}
});
//乡镇级属性模版
var popupTemplate = {
title: "乡镇数据",
content: [{
type: "fields",
fieldInfos: [{
fieldName: "name",
label: "行政单位名称",
format: {
places: 0,
digitSeparator: true
}
}, {
fieldName: "code",
label: "行政单位代码",
format: {
places: 0,
digitSeparator: true
}
}, {
fieldName: "supercode",
label: "上级行政单位代码",
format: {
places: 0,
digitSeparator: true
}
}, {
fieldName: "level",
label: "行政单位等级",
format: {
places: 0,
digitSeparator: true
}
}]
}]
};
var town = new FeatureLayer({
url: "https://localhost:6443/arcgis/rest/services/jiangxi/FeatureServer/0",
outFields: ["*"],
popupTemplate: popupTemplate
});//乡镇级数据
popupTemplate.title = "县级数据";
var county = new FeatureLayer({
url: "https://localhost:6443/arcgis/rest/services/jiangxi/FeatureServer/1",
outFields: ["*"],
popupTemplate: popupTemplate
});//县级数据
popupTemplate.title = "市级数据";
var city = new FeatureLayer({
url: "https://localhost:6443/arcgis/rest/services/jiangxi/FeatureServer/2",
outFields: ["*"],
popupTemplate: popupTemplate
});//市级数据
popupTemplate.title = "省级数据";
var province = new FeatureLayer({
url: "https://localhost:6443/arcgis/rest/services/jiangxi/FeatureServer/3",
outFields: ["*"],
popupTemplate: popupTemplate
});//省级数据
map.add(town);
map.add(county);
map.add(city);
map.add(province);
})
</script>
</body>
</html>
三维模式效果图:

---------------------
作者:GIS小博工作室
来源:CSDN
原文:https://blog.csdn.net/GISuuser/article/details/81246825
版权声明:本文为博主原创文章,转载请附上博文链接!