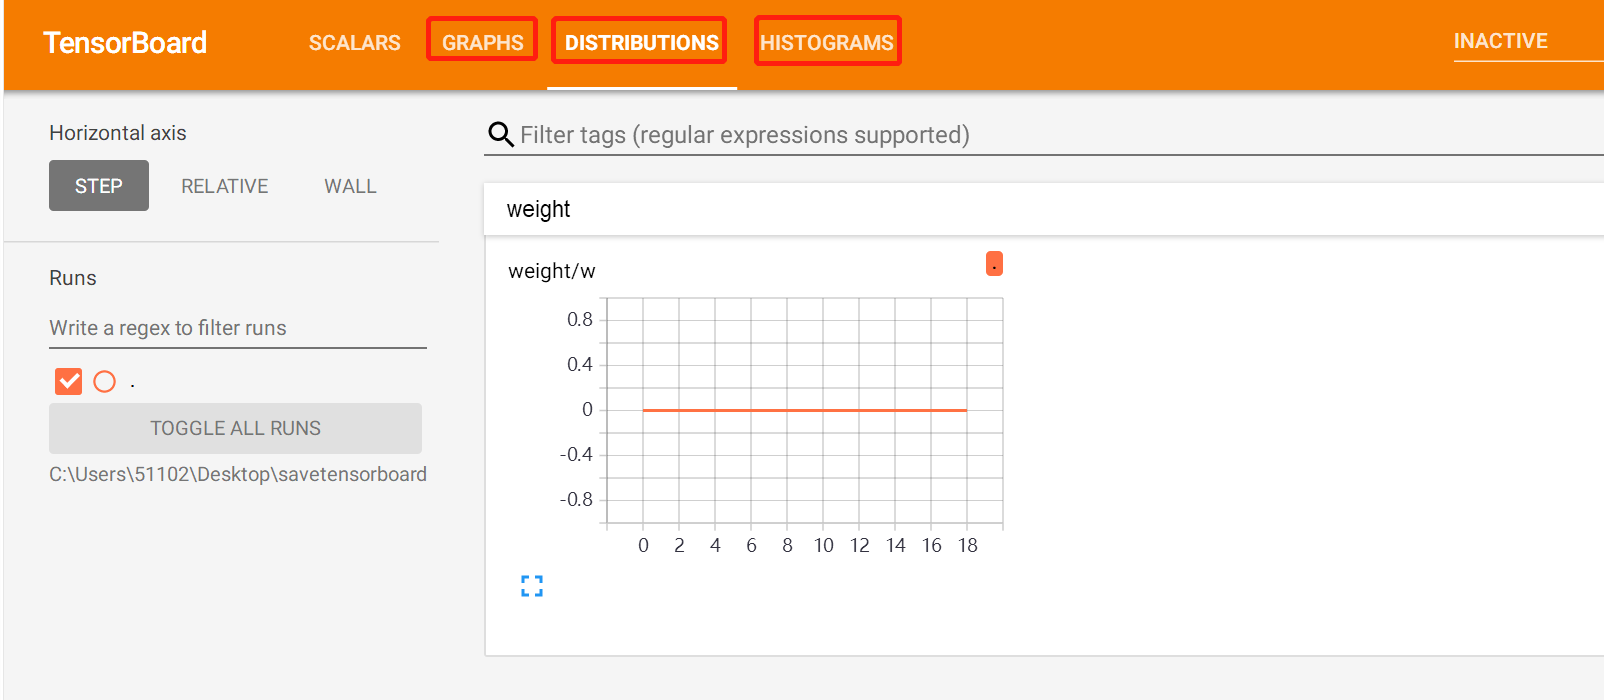
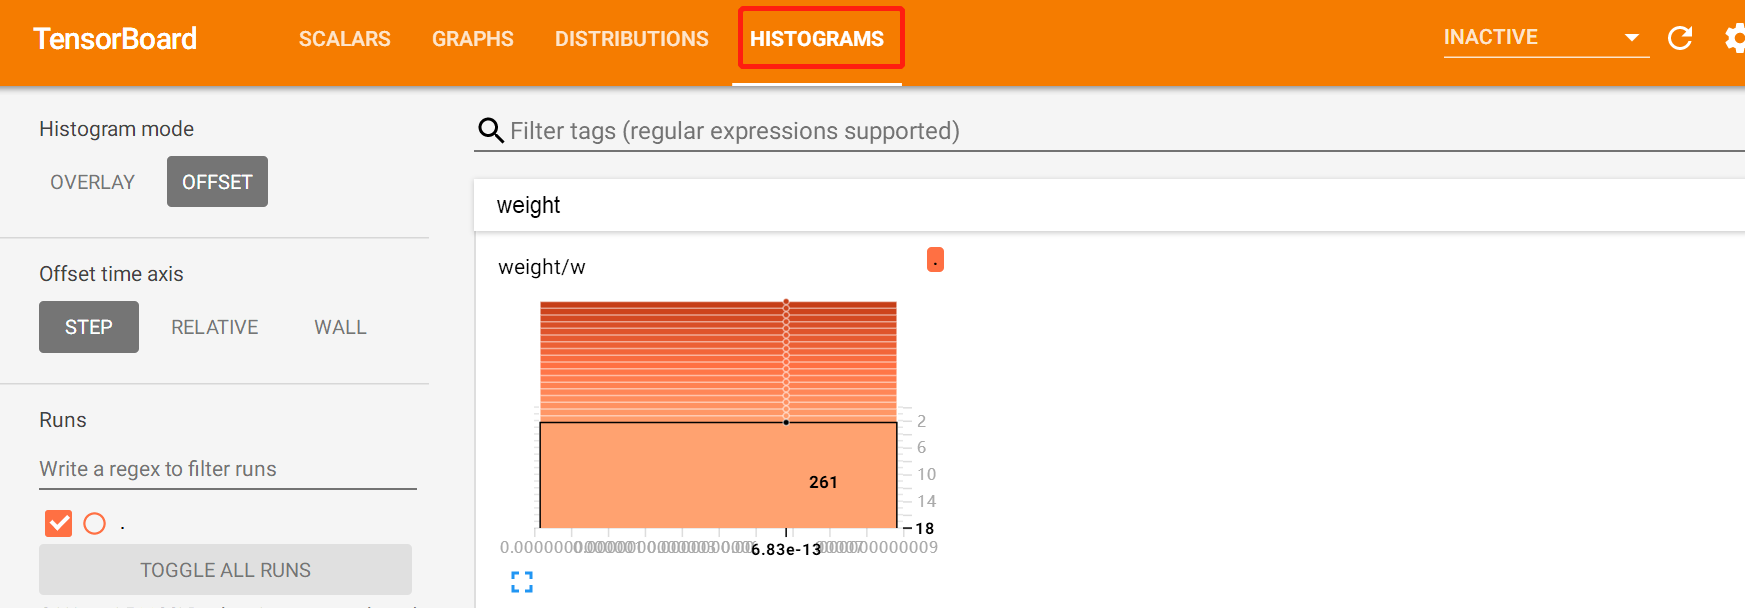
我使用tensorboard继续做了标量展示与直方图展示,在一的基础做了拓展,其改写代码如下:
import numpy as np
import tensorflow as tf
import random


# x_img = np.array(np.ones((5,784)))
y_lable =  np.array(np.zeros((5,10)))
for i in range(5):
    y_lable[i,2+i]=1


with tf.name_scope('input'):
    x = tf.placeholder(shape=[None,784],dtype=tf.float32,name='xinput')
    y_ = tf.placeholder( shape=[None,10],dtype=tf.float32,name='yinput')
with tf.name_scope('weight'):
    W = tf.Variable(tf.zeros([784,10]),dtype=tf.float32)
    tf.summary.histogram('w',W)
b = tf.Variable(tf.zeros([10]),tf.float32)
y = tf.nn.softmax(tf.matmul(x,W) + b)
with tf.name_scope('cross_ent'):
    cross_entropy = -tf.reduce_sum(y_*tf.log(y))                                  #损失函数
    tf.summary.scalar('cross_en',cross_entropy)
train_step = tf.train.GradientDescentOptimizer(0.01).minimize(cross_entropy)  #优化器

#定义测试的准确率                                                          #ragmaax()0表示按列,1表示按行,输出该列或行的最大值的下标值;equal()表示相等返回值为True或False
correct_prediction = tf.equal(tf.argmax(y,1),tf.argmax(y_,1))             #执行测试样本的准确率(全部的样本),计算相等值,为bool值,则为1和0
accuracy = tf.reduce_mean(tf.cast(correct_prediction,tf.float32))         #将全部的bool型转换为float32类型,在求平均值
tf.summary.scalar('accuracy',accuracy)

merged=tf.summary.merge_all()   # 该步骤很关键
sess=tf.Session()
writer=tf.summary.FileWriter('C:\Users\51102\Desktop\savetensorboard',sess.graph)  # 此步骤较为关键,特别是放置位置
sess.run(tf.global_variables_initializer())

for k in range(20):   # 迭代20次
    xx = np.zeros((5, 784)) # 下面是自己编造输入数据
    for i in range(5):
        for j in range(784):
            xx[i, j] = random.randint(0, 254)
    x_img=xx
    su,ac=sess.run([merged,accuracy],feed_dict={x:x_img,y_:y_lable})  # 主要用了merged
    writer.add_summary(su, k)   # 此步骤将其写入文件中
结果显示如下图:

