===========================================================================================
环境:
linux上的tomcat中部署了一个web服务,
时好时坏,经常上午启动,下午就无法访问。
总是莫名其妙的宕机。
===========================================================================================
解决步骤:
1.首先,在宕机的情况下,先不启动tomcat,去查看日志文件catalina.out
目录是在你的tomcat的目录下的logs目录下
tail -n 200 -f catalina.out
收集到的日志大致如下:


[GC [PSYoungGen: 1610144K->54342K(1998336K)] 2233750K->678204K(6777344K), 0.0687220 secs] [Times: user=0.22 sys=0.00, real=0.07 secs]
[GC [PSYoungGen: 1661510K->91007K(2016768K)] 2285372K->764127K(6795776K), 0.1119750 secs] [Times: user=0.29 sys=0.01, real=0.11 secs]
[GC [PSYoungGen: 1721727K->3808K(2003456K)] 2394847K->760833K(6782464K), 0.0980690 secs] [Times: user=0.27 sys=0.03, real=0.10 secs]
java.net.ConnectException: Connection timed out
    at java.net.PlainSocketImpl.socketConnect(Native Method)
    at java.net.AbstractPlainSocketImpl.doConnect(AbstractPlainSocketImpl.java:339)
    at java.net.AbstractPlainSocketImpl.connectToAddress(AbstractPlainSocketImpl.java:200)
    at java.net.AbstractPlainSocketImpl.connect(AbstractPlainSocketImpl.java:182)
    at java.net.SocksSocketImpl.connect(SocksSocketImpl.java:392)
    at java.net.Socket.connect(Socket.java:579)
    at org.apache.http.conn.scheme.PlainSocketFactory.connectSocket(PlainSocketFactory.java:117)
    at org.apache.http.impl.conn.DefaultClientConnectionOperator.openConnection(DefaultClientConnectionOperator.java:177)
    at org.apache.http.impl.conn.AbstractPoolEntry.open(AbstractPoolEntry.java:144)
    at org.apache.http.impl.conn.AbstractPooledConnAdapter.open(AbstractPooledConnAdapter.java:131)
    at org.apache.http.impl.client.DefaultRequestDirector.tryConnect(DefaultRequestDirector.java:611)
    at org.apache.http.impl.client.DefaultRequestDirector.execute(DefaultRequestDirector.java:446)
    at org.apache.http.impl.client.AbstractHttpClient.doExecute(AbstractHttpClient.java:882)
    at org.apache.http.impl.client.CloseableHttpClient.execute(CloseableHttpClient.java:82)
    at org.apache.http.impl.client.CloseableHttpClient.execute(CloseableHttpClient.java:107)
    at util.httpclient.HttpXmlClient.sendRequest(HttpXmlClient.java:234)
    at util.httpclient.HttpXmlClient.invoke(HttpXmlClient.java:201)
    at util.httpclient.HttpXmlClient.post(HttpXmlClient.java:43)
    at quartz.InvoiceApplyOrderStatusJob.getSalOrderStatus(InvoiceApplyOrderStatusJob.java:87)
    at quartz.InvoiceApplyOrderStatusJob.findOrderStatus(InvoiceApplyOrderStatusJob.java:45)
    at quartz.InvoiceApplyOrderStatusJob.excute(InvoiceApplyOrderStatusJob.java:37)
    at sun.reflect.NativeMethodAccessorImpl.invoke0(Native Method)
    at sun.reflect.NativeMethodAccessorImpl.invoke(NativeMethodAccessorImpl.java:57)
    at sun.reflect.DelegatingMethodAccessorImpl.invoke(DelegatingMethodAccessorImpl.java:43)
    at java.lang.reflect.Method.invoke(Method.java:606)
    at org.springframework.scheduling.support.ScheduledMethodRunnable.run(ScheduledMethodRunnable.java:64)
    at org.springframework.scheduling.support.DelegatingErrorHandlingRunnable.run(DelegatingErrorHandlingRunnable.java:53)
    at org.springframework.scheduling.concurrent.ReschedulingRunnable.run(ReschedulingRunnable.java:81)
    at java.util.concurrent.Executors$RunnableAdapter.call(Executors.java:471)
    at java.util.concurrent.FutureTask.run(FutureTask.java:262)
    at java.util.concurrent.ScheduledThreadPoolExecutor$ScheduledFutureTask.access$201(ScheduledThreadPoolExecutor.java:178)
    at java.util.concurrent.ScheduledThreadPoolExecutor$ScheduledFutureTask.run(ScheduledThreadPoolExecutor.java:292)
    at java.util.concurrent.ThreadPoolExecutor.runWorker(ThreadPoolExecutor.java:1145)
    at java.util.concurrent.ThreadPoolExecutor$Worker.run(ThreadPoolExecutor.java:615)
    at java.lang.Thread.run(Thread.java:745)
[ERROR][quartz.InvoiceApplyOrderStatusJob] [  ]
[ERROR][org.springframework.scheduling.support.TaskUtils$LoggingErrorHandler] [ Unexpected error occurred in scheduled task. ]
java.lang.NullPointerException
    at quartz.InvoiceApplyOrderStatusJob.findOrderStatus(InvoiceApplyOrderStatusJob.java:48)
    at quartz.InvoiceApplyOrderStatusJob.excute(InvoiceApplyOrderStatusJob.java:37)
    at sun.reflect.NativeMethodAccessorImpl.invoke0(Native Method)
    at sun.reflect.NativeMethodAccessorImpl.invoke(NativeMethodAccessorImpl.java:57)
    at sun.reflect.DelegatingMethodAccessorImpl.invoke(DelegatingMethodAccessorImpl.java:43)
    at java.lang.reflect.Method.invoke(Method.java:606)
    at org.springframework.scheduling.support.ScheduledMethodRunnable.run(ScheduledMethodRunnable.java:64)
    at org.springframework.scheduling.support.DelegatingErrorHandlingRunnable.run(DelegatingErrorHandlingRunnable.java:53)
    at org.springframework.scheduling.concurrent.ReschedulingRunnable.run(ReschedulingRunnable.java:81)
    at java.util.concurrent.Executors$RunnableAdapter.call(Executors.java:471)
    at java.util.concurrent.FutureTask.run(FutureTask.java:262)
    at java.util.concurrent.ScheduledThreadPoolExecutor$ScheduledFutureTask.access$201(ScheduledThreadPoolExecutor.java:178)
    at java.util.concurrent.ScheduledThreadPoolExecutor$ScheduledFutureTask.run(ScheduledThreadPoolExecutor.java:292)
    at java.util.concurrent.ThreadPoolExecutor.runWorker(ThreadPoolExecutor.java:1145)
    at java.util.concurrent.ThreadPoolExecutor$Worker.run(ThreadPoolExecutor.java:615)
    at java.lang.Thread.run(Thread.java:745)
[GC [PSYoungGen: 1634528K->3520K(2018304K)] 2391553K->761134K(6797312K), 0.0790130 secs] [Times: user=0.21 sys=0.00, real=0.08 secs]
[GC [PSYoungGen: 1647552K->71575K(2015232K)] 2405166K->829734K(6794240K), 0.1101140 secs] [Times: user=0.34 sys=0.01, real=0.11 secs]
[GC [PSYoungGen: 1715607K->75061K(2053120K)] 2473766K->898535K(6832128K), 0.1175420 secs] [Times: user=0.37 sys=0.00, real=0.12 secs]

Java HotSpot(TM) 64-Bit Server VM warning: Attempt to protect stack guard pages failed.
Java HotSpot(TM) 64-Bit Server VM warning: Attempt to deallocate stack guard pages failed.
Java HotSpot(TM) 64-Bit Server VM warning: Attempt to deallocate stack guard pages failed.
Java HotSpot(TM) 64-Bit Server VM warning: Attempt to deallocate stack guard pages failed.
Java HotSpot(TM) 64-Bit Server VM warning: INFO: os::commit_memory(0x00007f906fa7b000, 12288, 0) failed; error='Cannot allocate memory' (errno=12)
#
# There is insufficient memory for the Java Runtime Environment to continue.
# Native memory allocation (malloc) failed to allocate 12288 bytes for committing reserved memory.
# An error report file with more information is saved as:
# /backup/tomcat7/bin/hs_err_pid916618.log
Java HotSpot(TM) 64-Bit Server VM warning: INFO: os::commit_memory(0x00007f8f11051000, 12288, 0) failed; error='Cannot allocate memory' (errno=12)
2.从上面查看日志文件,可以分析出以下问题
1》第一,很多次的发生了新生代GC
[GC [PSYoungGen: 1975488K->5056K(2202112K)] 3281950K->1312494K(6981120K), 0.1478450 secs] [Times: user=0.43 sys=0.01, real=0.15 secs]
[GC [PSYoungGen: 1975488K->5056K(2202112K)] 3281950K->1312494K(6981120K), 0.1478450 secs] [Times: user=0.43 sys=0.01, real=0.15 secs]
1.GC 表示一次Minor GC(新生代垃圾收集)
2.PSYoungGen 表示新生代使用的是多线程垃圾收集器Parallel Scavenge
3.1975488K 表示垃圾收集之前新生代占用空间
4.5056K        表示垃圾收集之后新生代的空间
5.新生代又细分为一个Eden区和两个Survivor区,Minor GC之后Eden区为空,5056K就是Survivor占用的空间。
6.(2202112K)  表示整个年轻代的大小
7.3281950K->1312494K(6981120K) 则表示 垃圾收集之前3281950K   垃圾收集之后1312494K   的java堆大小,(6981120K)代表总堆大小,堆大小包括新生代和年老代。
8.[Times: user=0.43 sys=0.01, real=0.15 secs]提供cpu使用及时间消耗,
    user是用户模式垃圾收集消耗的cpu时间,实例中垃圾收集器消耗了0.43秒用户态cpu时间,
    sys是消耗系统态cpu时间,
    real是指垃圾收集器消耗的实际时间。
以上是拿了一条为例,解释这条信息的意义。
详细的参考地址:参考地址:https://jingyan.baidu.com/article/3ea51489c045d852e61bbaab.html
2》从这几条日志记录,可以看出java的运行环境想要继续运行下去,已经没有足够的内存支撑它了
# There is insufficient memory for the Java Runtime Environment to continue.
# Native memory allocation (malloc) failed to allocate 12288 bytes for committing reserved memory.
# An error report file with more information is saved as:
# /backup/tomcat7/bin/hs_err_pid916618.log
java运行环境,已经没有足够的内存支撑它运行下去了。
查看更多的错误日志信息,可以看:/backup/tomcat7/bin/hs_err_pid916618.log 这个文件
3.那在上面提示的目录下去查看这个文件
cat /backup/tomcat7/bin/hs_err_pid916618.log
文件详情如下:
#
# There is insufficient memory for the Java Runtime Environment to continue.
# Native memory allocation (malloc) failed to allocate 12288 bytes for committing reserved memory.
# Possible reasons:
#   The system is out of physical RAM or swap space
#   In 32 bit mode, the process size limit was hit
# Possible solutions:
#   Reduce memory load on the system
#   Increase physical memory or swap space
#   Check if swap backing store is full
#   Use 64 bit Java on a 64 bit OS
#   Decrease Java heap size (-Xmx/-Xms)
#   Decrease number of Java threads
#   Decrease Java thread stack sizes (-Xss)
#   Set larger code cache with -XX:ReservedCodeCacheSize=
# This output file may be truncated or incomplete.
#
#  Out of Memory Error (os_linux.cpp:2756), pid=916618, tid=140258326329088
#
# JRE version: Java(TM) SE Runtime Environment (7.0_79-b15) (build 1.7.0_79-b15)
# Java VM: Java HotSpot(TM) 64-Bit Server VM (24.79-b02 mixed mode linux-amd64 compressed oops)
# Failed to write core dump. Core dumps have been disabled. To enable core dumping, try "ulimit -c unlimited" before starting Java again
#

---------------  T H R E A D  ---------------

Current thread (0x00007f93bd3bc000):  JavaThread "elasticsearch[Cap 'N Hawk][generic][T#44]" daemon [_thread_new, id=869274, stack(0x00007f906fa7b000,0x00007f906fb7c000)]

Stack: [0x00007f906fa7b000,0x00007f906fb7c000],  sp=0x00007f906fb7a800,  free space=1022k
Native frames: (J=compiled Java code, j=interpreted, Vv=VM code, C=native code)
V  [libjvm.so+0x9a32da]  VMError::report_and_die()+0x2ea
V  [libjvm.so+0x497f7b]  report_vm_out_of_memory(char const*, int, unsigned long, char const*)+0x9b
V  [libjvm.so+0x81fcce]  os::Linux::commit_memory_impl(char*, unsigned long, bool)+0xfe
V  [libjvm.so+0x81fd8c]  os::pd_commit_memory(char*, unsigned long, bool)+0xc
V  [libjvm.so+0x817afa]  os::commit_memory(char*, unsigned long, bool)+0x2a
V  [libjvm.so+0x81e25d]  os::pd_create_stack_guard_pages(char*, unsigned long)+0x6d
V  [libjvm.so+0x95581e]  JavaThread::create_stack_guard_pages()+0x5e
V  [libjvm.so+0x95c164]  JavaThread::run()+0x34
V  [libjvm.so+0x821ca8][root@dscrmapp bin]#
关键的两点内容:
1》可能的原因
# Possible reasons:
#   The system is out of physical RAM or swap space
#   In 32 bit mode, the process size limit was hit
系统超出物理内存 或 虚拟内存
在32位的系统下,进程个数被限制了
2》可能的解决方法
# Possible solutions:
#   Reduce memory load on the system
#   Increase physical memory or swap space
#   Check if swap backing store is full
#   Use 64 bit Java on a 64 bit OS
#   Decrease Java heap size (-Xmx/-Xms)
#   Decrease number of Java threads
#   Decrease Java thread stack sizes (-Xss)
#   Set larger code cache with -XX:ReservedCodeCacheSize=
# 可能的解决方案:
#减少系统上的内存负载
#增加物理内存或交换空间
#检查交换后备存储是否已满
#在64位操作系统上使用64位Java
#减少Java堆大小(-Xmx / -Xms)
#减少Java线程的数量
#减少Java线程堆栈大小(-Xss)
#使用设置更大的代码缓存    -XX:ReservedCodeCacheSize=
4.解决顺序
在下面解决方法之前,一定要检查程序,处理好BUG,对异常进行捕获,尤其是多线程中,一定要正确捕获异常,对于不用的对象,释放引用,以确保GC可以正常的回收!!
4.1 确保系统是64位,并且java版本是64位
查看linux是centos还是ubuntu系统命令:
lsb_release -a

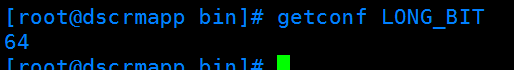
centOS查看系统32位还是64位
getconf LONG_BIT
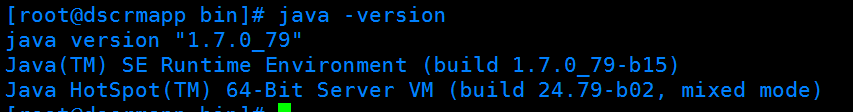
java版本确认
java -version
4.2 减小java堆大小和堆栈大小
原理参考地址:http://www.cnblogs.com/hrhguanli/p/4509544.html
异常的本质原因是因为,创建了太多的线程,没有及时回收。
而给jvm分配的内存越多,那么你能创建的线程数就越少。
进入tomcat的bin目录下
查找并编辑catalina.sh文件
vi catalina.sh
找到下面这行,对JVM的参数设置行,一般在【cygwin=false】上方一行
export JAVA_OPTS='-Xms7000m -Xmx8192m -XX:PermSize=1024m -XX:MaxPermSize=2048m -XX:+PrintGCDetails -server'
具体参数含义参考:https://www.cnblogs.com/sxdcgaq8080/p/7196580.html
可以看到这里对jvm的
初始化堆大小 -Xms7000m
最大堆大小 -Xmx8192m
[非堆内存]永久代初始大小 -XX:PermSize=1024m
[非对内存]永久代最大大小 -XX:MaxPermSize=2048m
修改参数为:
export JAVA_OPTS='-Xms2048m -Xmx3072m -XX:PermSize=1024m -XX:MaxPermSize=2048m -XX:+PrintGCDetails -server'
对堆大小减小一半多。
4.3 查看并增加虚拟内存
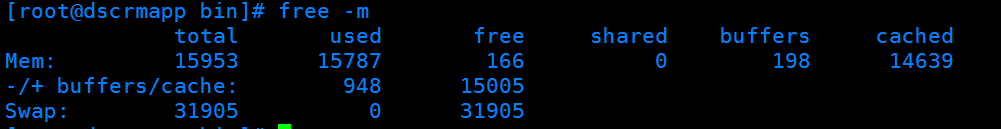
第一: 查看内存使用情况命令
free -m
-m 以M为单位展示
centOS 6.4增加虚拟内存:
参考地址:https://www.linuxidc.com/Linux/2014-09/106100.htm
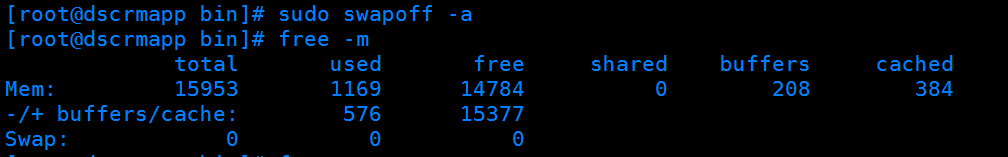
第二:关闭原本的swap
sudo swapoff -a
此时再查看 发现swap已经变成0
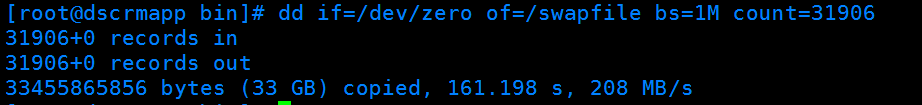
第三:设置新的swap大小
dd if=/dev/zero of=/swapfile bs=1M count=31906
of是指 在指定的路径创建swapfile文件
bs指的是Block Size,就是每一块的大小。这里的例子是1M,意思就是count的数字,是以1M为单位的。
count是告诉程序,新的swapfile要多少个block。这里是31906,就是说,新的swap文件是31906M大小,也就是将近32G。
注意:可能需要点时间完成此步,耐心等待完成。
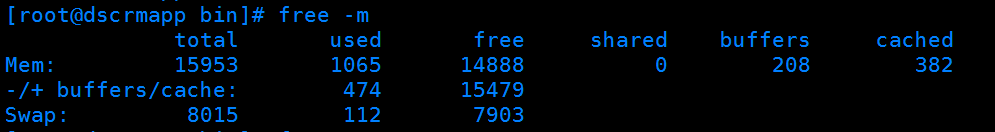
注意:swap大小原则,设置为物理内存的1-2倍大小。
因为最开始分析就是物理内存或swap内存不足导致,因此这里讲swap内存设置为物理内存的2倍大小。
设置完成就是这样
第四:把新增加的swapfile文件设置为swap文件
sudo mkswap /swapfile
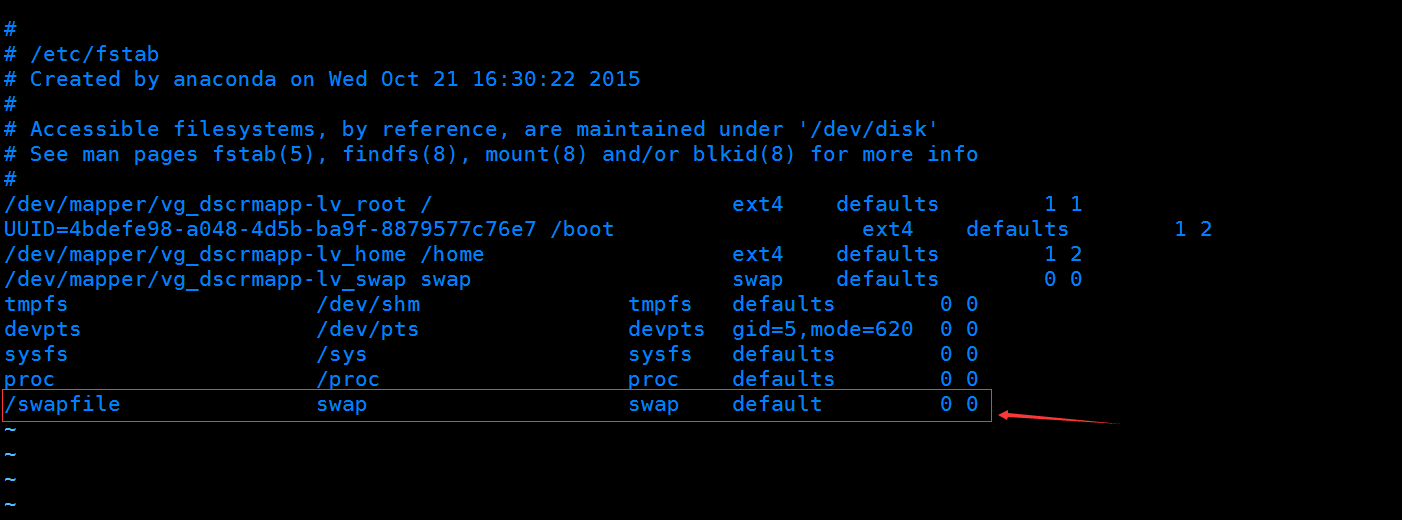
第五:修改/etc/fstab文件,让swap在启动时自动生效
vi /etc/fstab
在文件最后一行添加
/swapfile swap swap defaults 0 0
第六:重启服务器
命令:
reboot
重启后重新连接
第七:挂载swapfile文件
swapon /swapfile
查看swap