实验说明
一直想自己写一个神经网络来实现手写数字的识别,而不是套用别人的框架。恰巧前几天,有幸从同学那拿到5000张已经贴好标签的手写数字图片,于是我就尝试用matlab写一个网络。
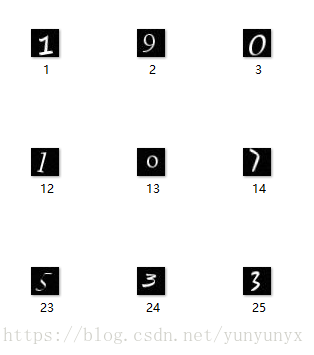
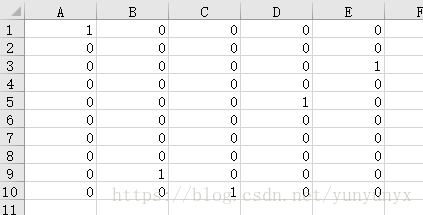
实验数据:5000张手写数字图片(.jpg),图片命名为1.jpg,2.jpg…5000.jpg。还有一个放着标签的excel文件。
数据处理:前4000张作为训练样本,后1000张作为测试样本。
图片处理:用matlab的imread()函数读取图片的灰度值矩阵(28,28),然后把每张图片的灰度值矩阵reshape为(28*28,1),然后把前4000张图片的灰度值矩阵合并为x_train,把后1000张图片的灰度值矩阵合并为x_test。
神经网络设计
网络层设计:一层隐藏层,一层输出层
输入层:一张图片的灰度值矩阵reshape后的784个数,也就是x_train中的某一列
输出层:(10,1)的列向量,其中列向量中最大的数所在的索引就是预测的数字
激励函数:sigmoid函数(公式)
更新法则:后向传播算法(参考)
一点说明:这里的训练我分别用了普通梯度下降法和mini_batch(batch size 为10)梯度下降法来实现
测试:用了两种方式表示正确率,一是统计预测正确的个数,而是利用matlab的plotconfusion函数
网络实现
全部实现包括5个函数(gedata.m / layerout.m / mytrain.m / mytrain_mini.m / test.m)和一个main.m文件。
读取数据(getdata.m)
function[x_train,y_train,x_test,y_test]=getdata()
%把图片变成像素矩阵
%path :图片路径
% x_train:训练样本像素矩阵(784,4000)
%y_train:训练样本标签(10,4000)
%x_test:测试样本像素矩阵(784,1000)
%y_test:测试样本标签(10,1000)


% photopath = './photo/';
% snames=dir([photopath  '*' '.jpg'])%get all filenames in photopath
% l = length(snames)
%
% %get x_ data
% x_train = [];
% x_test = [];
%
% for i=1:4000
%     iname=[photopath snames(i).name] %the path of jpg
%     x = imread(iname);  % the shape of x is (28,28)
%     x = reshape(x,784,1);  %reshape x to (784,1)
%     x_train = [x_train,x];
% end
%
% for k=4001:5000
%     kname=[photopath snames(k).name];  %the path of jpg
%     x = imread(kname);   %the shape of x is (28,28)
%     x = reshape(x,784,1);  %reshape x  to (784,1)
%     x_test = [x_test,x];
% end

x_train=[];

for i=1:4000
      x=im2double(imread(strcat(num2str(i),'.jpg')));
      x=reshape(x,784,1);
      x_train=[x_train,x];
end
x_test =[];

for k=4001:5000
      x=im2double(imread(strcat(num2str(k),'.jpg')));
      x=reshape(x,784,1);
      x_test=[x_test,x];
end
data=xlsread('label.xlsx');
y_train=data(:,1:4000);
y_test = data(:,4001:5000);

x_train;
y_train;
x_test;
y_test;

end
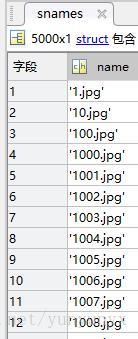
这里踩了一个坑。我本来读取图片,是按目录来读取的,然后训练出来的效果一直不好。一度怀疑自己的更新函数写错了,改了很久,才发现按目录读取的图片顺序是错误的!按目录读取的图片并不是按1,2,3…这样读的,而是按下面的顺序读取的,这样就和label对不上了!!!
layerout函数
function [y] = layerout(w,b,x)
%output function
y = w*x + b;
n = length(y);
for i =1:n
    y(i)=1.0/(1+exp(-y(i)));
end
y;
end
训练一(mytrain.m)
function[w,b,w_h,b_h]=mytrain(x_train,y_train)
%train function:设置一个隐藏层,784-->隐藏层神经元个数-->10
%x_train:训练样本的像素数据
%y_train:训练样本的标签
%w:输出层权重
%b:输出层偏置
%w_h:隐藏层权重
%b_h:隐藏层偏置
%step:循环步数

step=input('迭代步数:');
a=input('学习因子:');
in = 784; %输入神经元个数
hid = input('隐藏层神经元个数:');%隐藏层神经元个数
out = 10; %输出层神经元个数
o =1;

w = randn(out,hid);
b = randn(out,1);
w_h =randn(hid,in);
b_h = randn(hid,1);


for i=0:step
    %打乱训练样本
    r=randperm(4000);
    x_train = x_train(:,r);
    y_train = y_train(:,r);

    for j=1:4000
        x = x_train(:,j);
        y = y_train(:,j);

        hid_put = layerout(w_h,b_h,x);
        out_put = layerout(w,b,hid_put);

        %更新公式的实现
        o_update = (y-out_put).*out_put.*(1-out_put);
        h_update = ((w')*o_update).*hid_put.*(1-hid_put);

        outw_update = a*(o_update*(hid_put'));
        outb_update = a*o_update;
        hidw_update = a*(h_update*(x'));
        hidb_update = a*h_update;

        w = w + outw_update;
        b = b+ outb_update;
        w_h = w_h +hidw_update;
        b_h =b_h +hidb_update;
    end
end
end
训练二(mytrain_mini.m)
function[w,b,w_h,b_h]=mytrain_mini(x_train,y_train)
%train function:设置一个隐藏层,784-->隐藏层神经元个数-->10
%x_train:训练样本的像素数据
%y_train:训练样本的标签
%w:输出层权重
%b:输出层偏置
%w_h:隐藏层权重
%b_h:隐藏层偏置
%step:循环步数

step=ipout('迭代步数:');
a=input('学习因子:');
in = 784; %输入神经元个数
hid = input('隐藏层神经元个数:');%隐藏层神经元个数
out = 10; %输出层神经元个数
o =1;

w = randn(out,hid);
b = randn(out,1);
w_h =randn(hid,in);
b_h = randn(hid,1);


for i=0:step
    %打乱训练样本
    r=randperm(4000);
    x_train = x_train(:,r);
    y_train = y_train(:,r);
    %mini_batch
    for jj=0:399
        %取batch为10  更新取10次的平均值
        for j=jj*10+1:(jj+1)*10
            x = x_train(:,j);
            y = y_train(:,j);

            hid_put = layerout(w_h,b_h,x);
            out_put = layerout(w,b,hid_put);

            %更新公式的实现
            o_update = (y-out_put).*out_put.*(1-out_put);
            h_update = ((w')*o_update).*hid_put.*(1-hid_put);

            if j==1
                outw_update = (double(a)/10)*(o_update*(hid_put'));
                outb_update = (double(a)/10)*o_update;
                hidw_update = (double(a)/10)*(h_update*(x'));
                hidb_update = (double(a)/10)*h_update;
            end

            if j~=1
                outw_update = outw_update + (double(a)/10)*(o_update*(hid_put'));
                outb_update = outb_update -(double(a)/10)*o_update;
                hidw_update = hidw_update + (double(a)/10)*(h_update*(x'));
                hidb_update = hidb_update -(double(a)/10)*h_update;
            end
        end

        w = w + outw_update;
        b = b+ outb_update;
        w_h = w_h +hidw_update;
        b_h =b_h +hidb_update;
    end
end
end
测试(mytest.m)
function[]= mytest(x_test,y_test,w,b,w_h,b_h)
%x_test:测试样本的像素数据
%y_test:测试样本的标签
%w:输出层权重
%b:输出层偏置
%w_h:隐藏层权重
%b_h:隐藏层偏置

test = zeros(10,1000);
for k=1:1000
    x = x_test(:,k);

    hid = layerout(w_h,b_h,x);
    test(:,k)=layerout(w,b,hid);

    %正确率表示方式一:输出正确个数
    [t,t_index]=max(test);
    [y,y_index]=max(y_test);
    sum = 0;
    for p=1:length(t_index)
        if t_index(p)==y_index(p)
            sum =sum+1;
        end
    end
end

fprintf('正确率: %d/1000
',sum);

%正确率表示方式二:用plotconfusion函数
plotconfusion(y_test,test);
end
main.m
[x_train,y_train,x_test,y_test]=getdata();

%归一化
x_train = mapminmax(x_train,0,1);
x_test =mapminmax(x_test,0,1);

[w1,b1,w_h1,b_h1]=mytrain(x_train,y_train);
fprintf('mytrain正确率:
');
mytest(x_test,y_test,w1,b1,w_h1,b_h1);

[w2,b2,w_h2,b_h2]=mytrain(x_train,y_train);
fprintf('mytrain_mini正确率:
');
mytest(x_test,y_test,w2,b2,w_h2,b_h2);
实验结果
直接运行main.m,且两个训练方式都输入相同参数,得到结果如下:
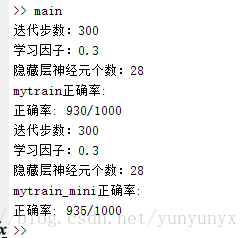
下面是mini_batch的plotconfusion结果,mytrain的也差不多。其中绿色的为正确率:
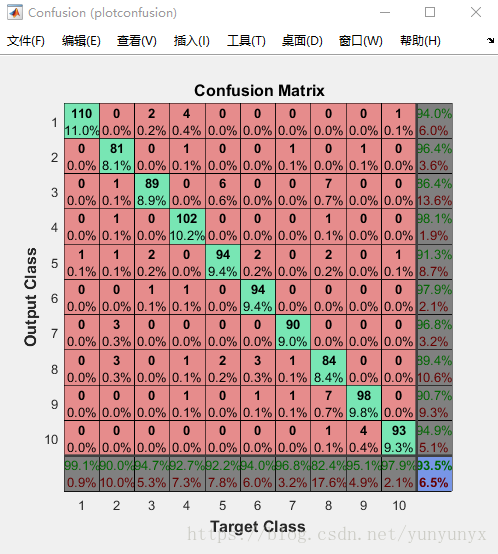
直观感觉min_batch方式的训练会快一丢丢。由于这里数据不多,所以两者的差别看不大出来!