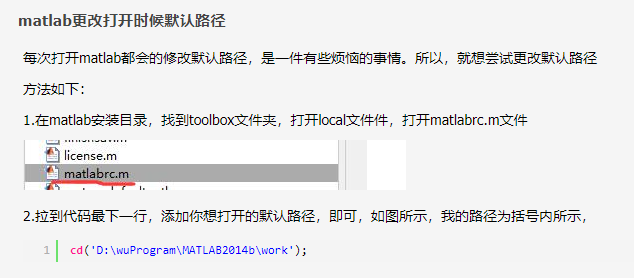
一、matlab 更改打开时的默认路径
参考网址:https://www.cnblogs.com/mat-wu/p/6135555.html
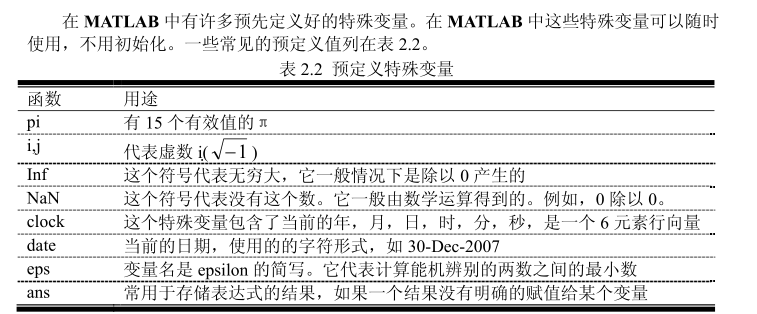
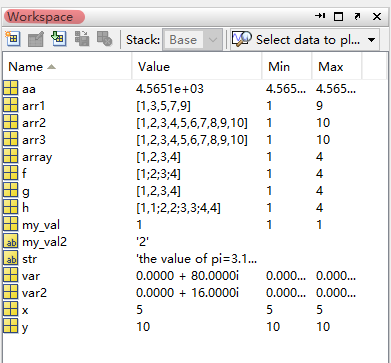
二、matlab 预定义的特殊变量
pi, i, j, clock, date都是matlab预定义的特殊变量,命名的时候注意不要重名。
三、matlab 简单使用demo
在Command Window 输入命令 clc 清空Command Window; clear 清空 Workspace; filename 直接运行 .m文件。
matlab 代码中 % 后是单行注释,添加注释快捷键是 Ctrl + R ;取消注释快捷键是 Ctrl + T 。
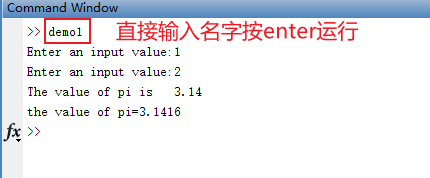
demo1.m
% C 语言中,变量类型和变量在使用之前必须强制声明。这种语言叫强类型语言。
% MATLAB 是弱类型语言,直接赋值就可以创建变量,变量类型取决于创建时的类型。

var = 40*2i; % matlab 中i、j用来表示虚数,用 2i 这种形式提高速度和鲁棒性
var2 = var/5;
array = [1,2,3,4]; % 数组中的元素可以用空格分隔,也可以用逗号分隔
x = 5;
y = 10;

% first:incr:last  克隆运算符,incr=1时可省略
arr1 = 1:2:10;
arr2 = 1:1:10;
arr3 = 1:10;

% 转置运算符
g = 1:4;
h = [g' g'];

% 用input初始化变量
my_val = input('Enter an input value:');
my_val2 = input('Enter an input value:','s'); %input('descript:','s')输入的数据就被当字符串

% Conmmand Window 命令:输出显示格式 format short(默认),format bank(无科学记数法)
aa = 4565.13246;
% fprintf()  和c语言中print用法一样。缺点:只能显示复数的实部,所以有虚数时要用disp()
fprintf('The value of pi is %6.2f \n',pi);
% disp()  num2ster()   int2str
str = ['the value of pi='  num2str(pi)];
disp(str);
四、matlab plot()的基础使用
有多个plot()时,后面的图像会覆盖前面的图像。
demo2.m
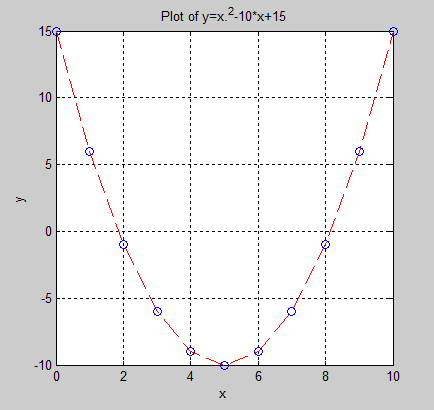
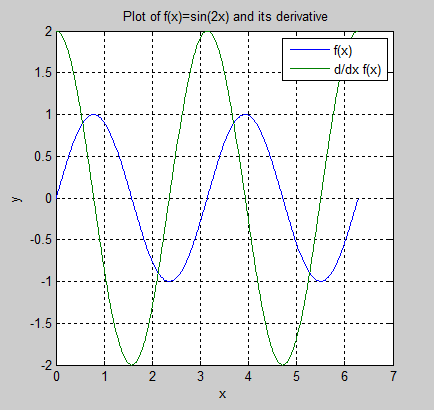
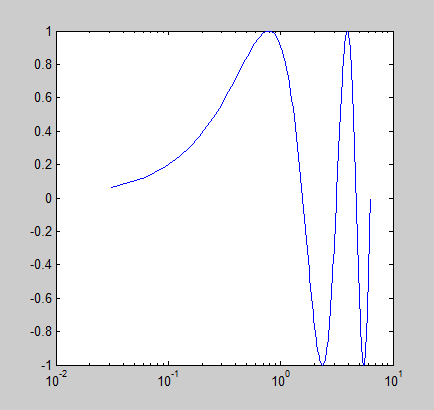
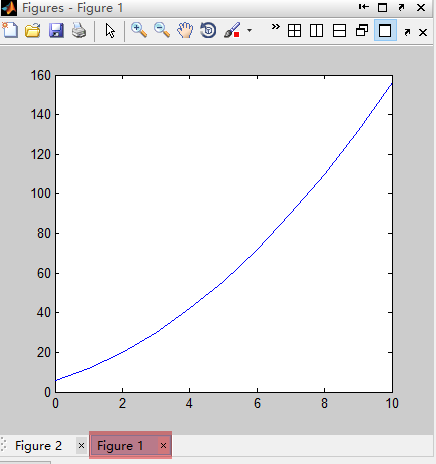
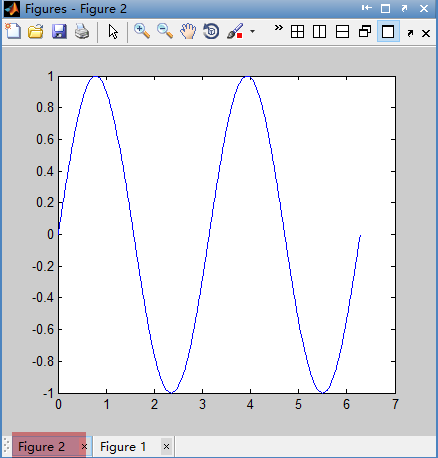
% plot() 的使用方法
x=0:1:10;
y=x.^2-10*x+15;
% plot(x,y);
% 曲线为红色的虚线,重要的数值用蓝色的小圆圈表示
% plot(x,y,'r--',x,y,'bo');
title ('Plot of y=x.^2-10*x+15');
xlabel ('x');
ylabel ('y');
grid on; % grid off 去除网格线

% 联合绘图
x1 = 0:pi/100:2*pi;
y1 = sin(2*x1);
y2 = 2*cos(2*x1);
plot (x1,y1,x1,y2);
title(' Plot of f(x)=sin(2x) and its derivative');
xlabel('x');
ylabel('y');
% legend 制作图例
legend('f(x)','d/dx f(x)');
grid on;
% 对数尺度
semilogx(x1,y1)
四个图像分别是 plot(x,y); plot(x,y,'r--',x,y,'bo'); plot (x1,y1,x1,y2); semilogx(x1,y1) 的图像。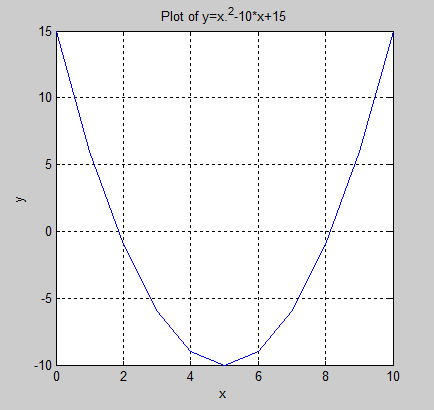
五、matlab 应用的两个小例子
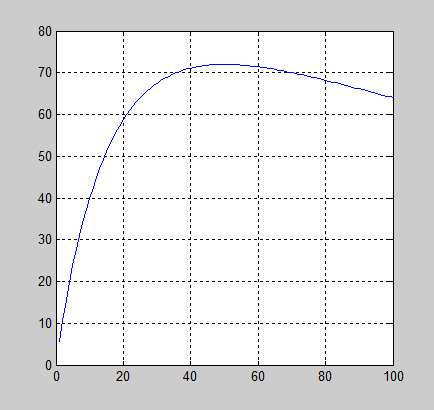
example1:读取一个华氏温度的输入,输出为开尔文温度、example2:负载的最大输出功率。
demo3.m
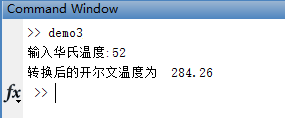
% example1:读取一个华氏温度的输入,输出为开尔文温度
var = input('输入华氏温度:');
f = 5/9 * (var -32) + 273.15;
fprintf('转换后的开尔文温度为  %6.2f \n ',f);

% example2:负载的最大输出功率
% 注意在本例中,用的是数组运算符 .*   .^和   ./
% 这些运算符将会使数组 amps 和 pl 按元素一一对应计算.
V = 120;
Rs = 50;
Rl = 1:1:100;
I = V ./ ( Rs + Rl); % ./
PL = I.^2 .* Rl; % .^  .* 都要带 .
plot(Rl,PL);
grid on;
输出结果:
六、matlab常用语法(if、figure、hold on、极坐标、while、for循环、全局变量)
demo4.m
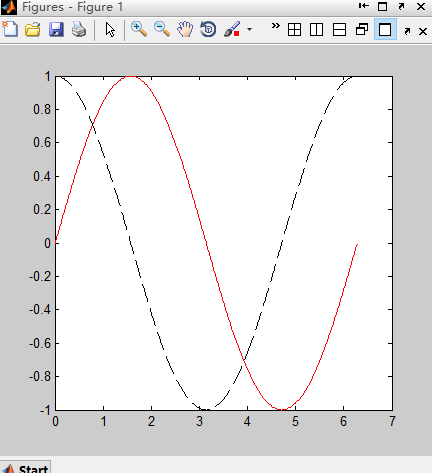
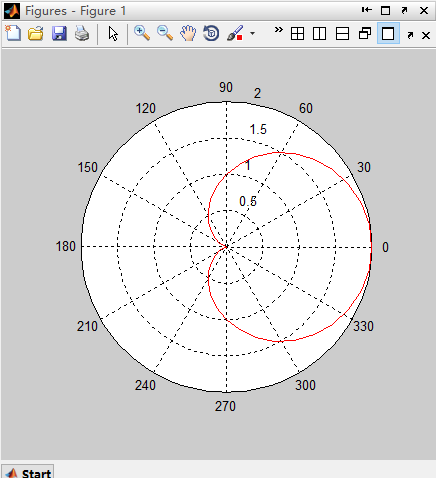
% *************************** if else *******************************
% if  else之间是第一个block; else  end之间是第二个block
% 或者if  end之间是一个block,和缩进无关,缩进只是为了方便阅读。
% a = 2;
% disp('I am if statement:')
% if a==1
%     fprintf('a is 1 \n');
%     fprintf('I am a. \n');
% else
%     fprintf('a is not 1 \n');
%     fprintf('I am not a. \n');
% end

% ***************************** figure *****************************
% x = 0:10;
% y = x.^2 + 5*x + 6;
% figure(1); % 创建多个图像
% plot(x,y);

% x1 = 0:pi/100:2*pi;
% y1 = sin(2*x1);
% figure(2);% 创建多个图像
% plot(x1,y1);

% **********************************************************
% hold on 所有的新的图象都会叠加在原来存在的图象。
% hold off 命令可恢复默认情况,用新的图象来替代原来的图象。
% x1 = 0:pi/100:2*pi;
% y1 = sin(x1);
% y2 = cos(x1);
% hold off;
% plot(x1,y1,'r');
% hold on;
% plot(x1,y2,'k--');
% hold off;
% ******************************* 极坐标 ***************************
% 极坐标
g = 0.5;
theta = 0:pi/20:2*pi;
gain = 2*g*(1+cos(theta));
polar (theta,gain,'r-');
% ****************************** while ****************************
% while   end 之间是block
b = 1;
while(b <= 5)
    disp(b);
    b = b+1;
end
% **************************** for ******************************
% for   end 之间是block
%  for 循环算法比向量算法慢
for c = 1:2:10  % for c = [1,5,7,9]
   fprintf('c^2 is %d \n',c^2);
end
disp('************************向量化************************')
% 用向量算法代替循环的算法的过程称之为向量化(vectorization)
% 向量执行的速度快,缺点是需要很大的内存,但仍要比 for 循环好的多
cc = 1:2:10;
ccc = cc.^2;
fprintf('ccc is %d \n',ccc);
% **************************** 全局变量 ******************************
% 可以用global声明全局变量。
% 为了方便,应该在函数开头就声明全局变量。
% 全局变量适用大规模数据的传输
global var1 var2 var3 ;
 var1 = 1;
 var2 = 2;
 var3 = 3;
if 语句输出结果:
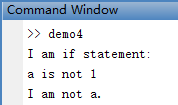
figure 语句输出结果:
hold on、hold off 语句输出结果:
极坐标 语句输出结果:
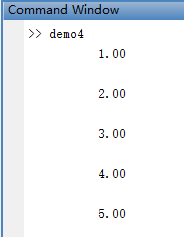
while 语句输出结果:
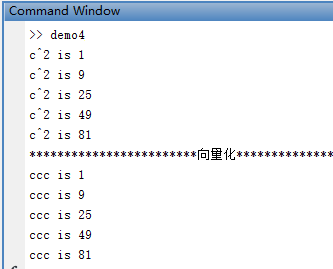
for 循环语句输出结果:
七、matlab 自定义函数
demo5_myFunction.m (自定义函数)
% 在这个文件里自定义函数,函数名必须和文件名一致
% 函数脚本不需要运行,只要保存即可
% function result = filename(params)  //这里的函数名字必须和文件名一致
% function block

function distance = demo5_myFunction (x1, y1, x2, y2)
%DIST2 Calculate the distance between two point
% Function DIST2 calculates the distance between
% two points (x1, y1) and (x2,y2) in a cartesian
% coordinate system.
%
% Calling sequence:
% res = dist2(x1, y1, x2, y2)
%
% Define variables:
% x1  --x-position of point 1
% y1  --y-position of point 1
% x2  --x-position of point 2
% y2  --y-position of point 2
% distance --Distance between points
%
% Record of revisions:
%  Date Pragrammer  Description of change
%  ========  ========== ================
%  12/15/98 S.J.Chapman Original code
%
% Calculate distance.

% 函数体内容
distance = sqrt((x2-x1).^2 + (y2-y1).^2);
demo5_myFunction_useFunction.m(调用自定义函数)
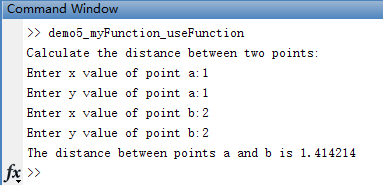
% 在这个文件调用自定义函数
%  Script file: test_dist2.m
%
%  Purpose:
%  This program test2 function dist2.
%
%  Record of revisions:
%  Date Pragrammer  Description of change
%  ========  ========== ================
%  12/15/98 S.J.Chapman Original code
%
%  Define variables:
%  ax  --x-position of point a
%  ay  --y-position of point a
%  bx --x-position of point b
%  by --x-position of point b
%
%  Get input data.
disp('Calculate the distance between two points:');
ax = input ('Enter x value of point a:');
ay = input ('Enter y value of point a:');
bx = input ('Enter x value of point b:');
by = input ('Enter y value of point b:');

%  Evaluate function
% 调用自定义函数  result = 自定义函数文件名(params)
result = demo5_myFunction (ax, ay, bx, by); % 调用自定义只有这一句
%  Write out result.
fprintf('The distance between points a and b is %f \n', result);
运行结果:
自定义函数2 :
demo5_calc2.m
% 自定义函数 example2
% 有多个输出,写在[]中;输出只有一个时[]可以省略
% 函数结尾的result可以写,但没必要(运行到最后一行函数自然停止)
% 自定义函数接受不固定个输入参数,请搜索 “选择性参数、inputParser”
function [y1,y2] = demo5_calc2(x1,x2)
y1 = x1^2;
y2 = x2^2;

disp(['max(x1,x2):',num2str(max(x1,x2))]);

% ******************************************
% max()只能被同一文件中的其它函数调用,是子函数
% 私有函数有 private 声明的子函数,它们只能被父目录中的函数访问
% 子函数和私有函数主要用于限制 MATLAB 函数的访问
function a = max(m,n)

if(m<n)
    a = n;
else if(m > n)
     a = m;
    end;
end;
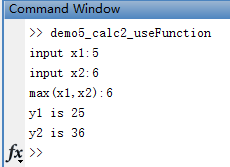
demo5_calc2_useFunction.m
% 使用自定义函数 example2
x1 = input('input x1:');
x2 = input('input x2:');
% 调用自定义函数格式就是:
%   自定义函数文件中第一行代码去掉 function 剩下的部分
%       function [y1,y2] = demo5_calc2(x1,x2)
[y1,y2] = demo5_calc2(x1,x2);
disp(['y1 is ', num2str(y1)]);
disp(['y2 is ', num2str(y2)]);
运行结果: