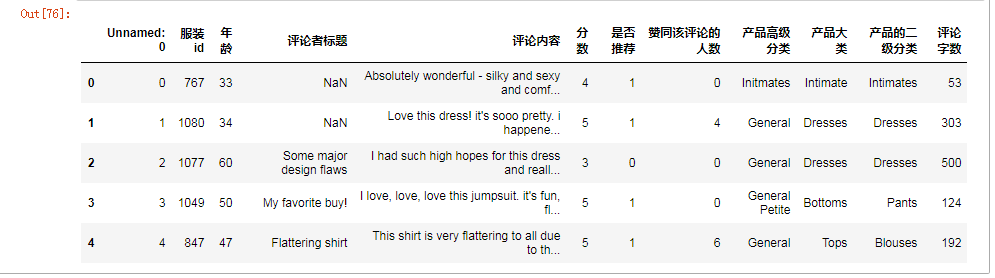
#auther bioamin
#nlp of 电商评论
#-*- conding = utf-8 -*-
import numpy as np
import pandas as pd
#画图的包
import  matplotlib.pyplot as plt
import seaborn as sns
plt.rcParams['font.sans-serif']=['SimHei']
plt.rcParams['axes.unicode_minus']=False
#忽略警告
import  warnings
warnings.filterwarnings("ignore")
import  missingno
new_cloumname = {"Clothing ID":"服装id","Age":"年龄","Title":"评论者标题",
                 "Review Text":"评论内容","Rating":"分数","Recommended IND":"是否推荐",
                 "Positive Feedback Count":"赞同该评论的人数",
                 "Division Name":"产品高级分类",
                 "Department Name":"产品大类",
                 "Class Name":"产品的二级分类"}
#读取数据并且利用 rename() 函数输入字典替换列名
df = pd.read_csv("Comment.csv")
df=df.rename(columns = new_cloumname)
df.head()

missingno.matrix(df,fontsize = 25)
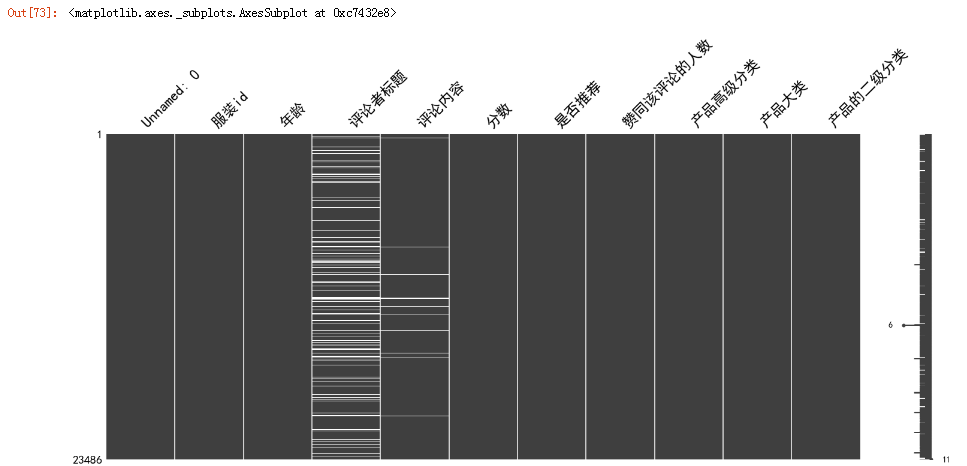
col = "评论内容"
#删除缺失值
df = df.dropna(subset=[col])
missingno.matrix(df,fontsize = 25)

#增加新特征
df["评论字数"]=df["评论内容"].astype(str).apply(len)
df.head()
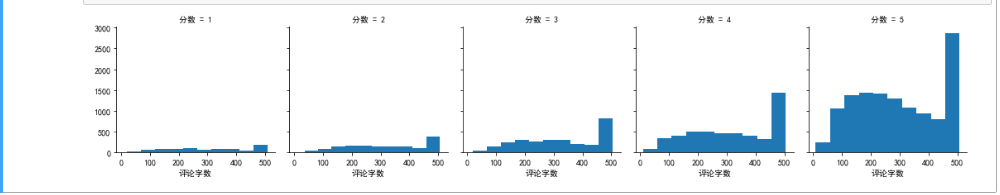
#评分和字数 数据可视化
#先sns.FacetGrid画出轮廓
#然后用map填充内容
g = sns.FacetGrid(data = df,col = "分数")
g.map(plt.hist,"评论字数",bins=10)
plt.show()
#评分越高,评论字数越多
#评分与字数关系的可视化2
sns.pointplot(x="分数",y="评论字数",data=df)
plt.show()
#评分为3的人最喜欢写评论

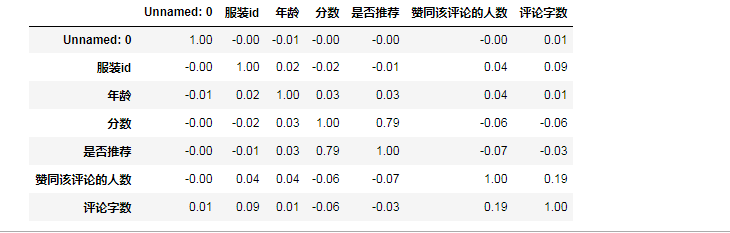
#找出与服装评分相关性最强的10个变量
k=10
#df.corr()  相关系数的计算可以调用pearson方法或kendell方法或spearman方法,默认使用pearson方法。
#round()  四舍五入,保留2位小数
corr = round(df.corr(),2)
corr
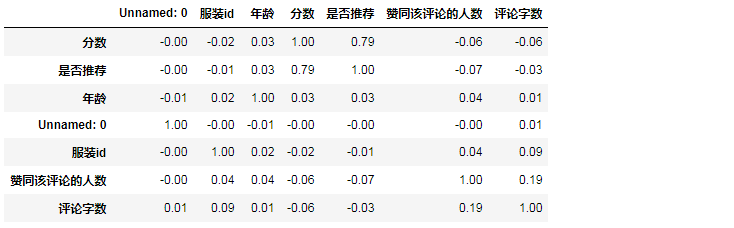
#panadas.Dataframe
# pd.DataFrame.nlargest(n ,cloumns,keep="first")  get the row of a DataFrame by the largest values of columns
cols = corr.nlargest(k,'分数')
cols
cols = corr.nlargest(k,'分数')["分数"].index
cm = round(df[cols].corr(),2)
#np.zeros_like()    Return an array of zeros with the same shape and type as a given array.
#
mask = np.zeros_like(cm,dtype = np.bool)
mask[np.triu_indices_from(mask)] = True
plt.figure(figsize = (8,8))
cmap = sns.diverging_palette(220,10,as_cmap = True)
sns.heatmap(cm,mask = mask,cmap = cmap ,center = 0,annot = True ,cbar_kws = {"shrink":.5})

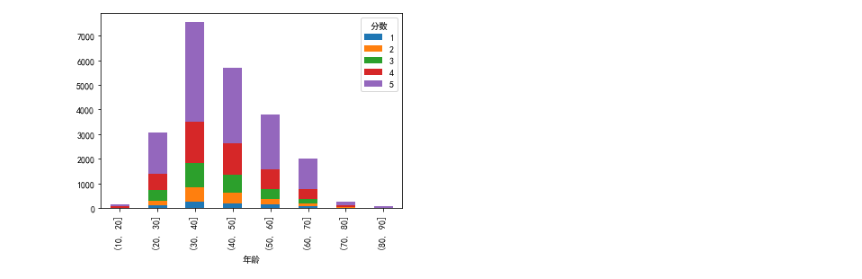
df.groupby(["分数",pd.cut(df["年龄"],np.arange(0,100,10))]).size().unstack(0).plot.bar(stacked = True)

plt.show()
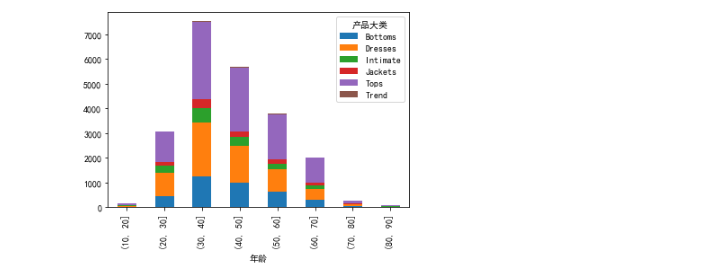
#产品类别与年龄
df.groupby(["产品大类",pd.cut(df["年龄"],np.arange(0,100,10))]).size().unstack(0).plot.bar(stacked = True)

plt.show()
30-40 40-50是购物的主要年龄段 在各个产品类别中,top在各个年龄段的销量都不错