===============================================
2021/4/10_第4次修改 ccb_warlock
更新说明:
2021/4/10:
1.补充了alertmanager触发告警时收到邮件的截图;
2.增加了cadvisor、kube-state-metrics、prometheus、grafana、alertmanager的功能描述;
2021/2/16:
1.增补了kube-state-metrics镜像的获取教程;
2.补全了prometheus、grafana的内容;
2021/2/15:
1.增加了grafana和部分标题;
===============================================
在很多年前整理过的容器监控方案(https://www.cnblogs.com/straycats/p/9281889.html)中,曾经采用在docker swarm中运行cAdvisor、Prometheus、Grafana来实现对容器与宿主机的监控。因为懂docker,上个月又被当作运维要求通过在kubernetes上实现监控系统的解决方案,于是我需要实现在kubernetes上运行这套解决方案。
在使用grafana的demo时,了解到监控k8s资源有个比cAdvisor更好用的服务Kube-state-metrics。
cAdvisor:采集os指标、docker指标的数据(kubelet已集成)
Kube-state-metrics:采集kubernetes指标的数据
Prometheus:检索、存储数据
Grafana:可视化通过检索服务得到的数据(例如Prometheus)
一、部署kubernetes
centos7可以参考:https://www.cnblogs.com/straycats/p/14322995.html
PS.写教程时部署的版本是v1.20.1
二、创建命名空间
kubectl create namespace monit
三、部署cAdvisor
因为在kubernetes上运行,而kubelet已经集成了cAdvisor,所以不需要额外安装,直接使用kubelet即可。
四、部署Kube-state-metrics
4.1 创建编排脚本
# 创建目录
mkdir -p /opt/yaml
# 创建编排脚本
vi /opt/yaml/kube-state-metrics.yaml
将下面的内容保存到kube-state-metrics.yaml中,wq保存。
apiVersion: rbac.authorization.k8s.io/v1
kind: ClusterRole
metadata:
  labels:
    app.kubernetes.io/name: kube-state-metrics
    app.kubernetes.io/version: v2.0.0-beta
  name: kube-state-metrics
rules:
- apiGroups:
  - ""
  resources:
  - configmaps
  - secrets
  - nodes
  - pods
  - services
  - resourcequotas
  - replicationcontrollers
  - limitranges
  - persistentvolumeclaims
  - persistentvolumes
  - namespaces
  - endpoints
  verbs:
  - list
  - watch
- apiGroups:
  - extensions
  resources:
  - daemonsets
  - deployments
  - replicasets
  - ingresses
  verbs:
  - list
  - watch
- apiGroups:
  - apps
  resources:
  - statefulsets
  - daemonsets
  - deployments
  - replicasets
  verbs:
  - list
  - watch
- apiGroups:
  - batch
  resources:
  - cronjobs
  - jobs
  verbs:
  - list
  - watch
- apiGroups:
  - autoscaling
  resources:
  - horizontalpodautoscalers
  verbs:
  - list
  - watch
- apiGroups:
  - authentication.k8s.io
  resources:
  - tokenreviews
  verbs:
  - create
- apiGroups:
  - authorization.k8s.io
  resources:
  - subjectaccessreviews
  verbs:
  - create
- apiGroups:
  - policy
  resources:
  - poddisruptionbudgets
  verbs:
  - list
  - watch
- apiGroups:
  - certificates.k8s.io
  resources:
  - certificatesigningrequests
  verbs:
  - list
  - watch
- apiGroups:
  - storage.k8s.io
  resources:
  - storageclasses
  - volumeattachments
  verbs:
  - list
  - watch
- apiGroups:
  - admissionregistration.k8s.io
  resources:
  - mutatingwebhookconfigurations
  - validatingwebhookconfigurations
  verbs:
  - list
  - watch
- apiGroups:
  - networking.k8s.io
  resources:
  - networkpolicies
  verbs:
  - list
  - watch

---
apiVersion: v1
kind: ServiceAccount
metadata:
  labels:
    app.kubernetes.io/name: kube-state-metrics
    app.kubernetes.io/version: v2.0.0-beta
  name: kube-state-metrics
  namespace: monit

---
apiVersion: rbac.authorization.k8s.io/v1
kind: ClusterRoleBinding
metadata:
  labels:
    app.kubernetes.io/name: kube-state-metrics
    app.kubernetes.io/version: v2.0.0-beta
  name: kube-state-metrics
roleRef:
  apiGroup: rbac.authorization.k8s.io
  kind: ClusterRole
  name: kube-state-metrics
subjects:
- kind: ServiceAccount
  name: kube-state-metrics
  namespace: monit

---
apiVersion: v1
kind: Service
metadata:
  annotations:
    prometheus.io/scrape: 'true'
  labels:
    app.kubernetes.io/name: kube-state-metrics
    app.kubernetes.io/version: v2.0.0-beta
  name: kube-state-metrics
  namespace: monit
spec:
  type: NodePort
  ports:
  - name: http-metrics
    port: 8080
    targetPort: http-metrics
    #nodePort: 30001
  - name: telemetry
    port: 8081
    targetPort: telemetry
    #nodePort: 30002
  selector:
    app.kubernetes.io/name: kube-state-metrics

---
apiVersion: apps/v1
kind: Deployment
metadata:
  labels:
    app.kubernetes.io/name: kube-state-metrics
    app.kubernetes.io/version: v2.0.0-beta
  name: kube-state-metrics
  namespace: monit
spec:
  replicas: 1
  selector:
    matchLabels:
      app.kubernetes.io/name: kube-state-metrics
  template:
    metadata:
      labels:
        app.kubernetes.io/name: kube-state-metrics
        app.kubernetes.io/version: v2.0.0-beta
    spec:
      containers:
      - image: k8s.gcr.io/kube-state-metrics/kube-state-metrics:v2.0.0-beta
        livenessProbe:
          httpGet:
            path: /healthz
            port: 8080
          initialDelaySeconds: 5
          timeoutSeconds: 5
        name: kube-state-metrics
        ports:
        - containerPort: 8080
          name: http-metrics
        - containerPort: 8081
          name: telemetry
        readinessProbe:
          httpGet:
            path: /
            port: 8081
          initialDelaySeconds: 5
          timeoutSeconds: 5
      nodeSelector:
        beta.kubernetes.io/os: linux
      serviceAccountName: kube-state-metrics
PS.获取kube-state-metrics镜像,请参考:https://www.cnblogs.com/straycats/p/14405513.html
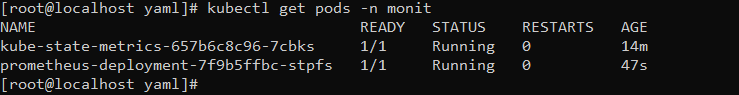
4.2 部署
# 执行编排脚本
cd /opt/yaml
kubectl apply -f kube-state-metrics.yaml


五、部署Prometheus
5.1 创建数据持久化目录
mkdir -p /opt/vol/prometheus/data
5.2 创建编排脚本
# 创建目录
mkdir -p /opt/yaml
# 创建编排脚本
vi /opt/yaml/prometheus.yaml
将下面的内容保存到prometheus.yaml中,wq保存。
apiVersion: rbac.authorization.k8s.io/v1
kind: ClusterRole
metadata:
  name: warlock
  namespace: monit
rules:
- apiGroups: [""]
  resources:
  - nodes
  - nodes/proxy
  - nodes/metrics
  - services
  - services/proxy
  - endpoints
  - endpoints/proxy
  - pods
  - pods/proxy
  verbs: ["get", "list", "watch"]

---
apiVersion: v1
kind: ServiceAccount
metadata:
  name: warlock
  namespace: monit

---
apiVersion: rbac.authorization.k8s.io/v1
kind: ClusterRoleBinding
metadata:
  name: warlock
  namespace: monit
roleRef:
  apiGroup: rbac.authorization.k8s.io
  kind: ClusterRole
  name: warlock
subjects:
- kind: ServiceAccount
  name: warlock
  namespace: monit

---
apiVersion: v1
kind: Service
metadata:
  name: prometheus-service
  namespace: monit
  labels:
    app: prometheus-service
    kubernetes.io/cluster-service: "true"
    addonmanager.kubernetes.io/mode: EnsureExists
spec:
  type: NodePort
  ports:
  - port: 9090
    targetPort: 9090
    nodePort: 9090
  selector:
    app: prometheus-deployment

---
apiVersion: v1
kind: ConfigMap
metadata:
  name: prometheus-config
  namespace: monit
data:
  prometheus.yml: |
    global:
      scrape_interval:     15s
      evaluation_interval: 15s

    alerting:
      alertmanagers:
      - static_configs:
        - targets:
          - alertmanager-service:9093

    rule_files:
      - "node.yml"

    scrape_configs:
      - job_name: 'prometheus'
        static_configs:
          - targets: ['localhost:9090']

      - job_name: 'k8s-cadvisor'
        metrics_path: /metrics/cadvisor
        kubernetes_sd_configs:
        - role: node
        relabel_configs:
        - action: labelmap
          regex: __meta_kubernetes_node_label_(.+)
        scheme: https
        tls_config:
          insecure_skip_verify: true
        bearer_token_file: /var/run/secrets/kubernetes.io/serviceaccount/token
        metric_relabel_configs:
        - source_labels: [instance]
          separator: ;
          regex: (.+)
          target_label: node
          replacement: $1
          action: replace
        - source_labels: [pod_name]
          separator: ;
          regex: (.+)
          target_label: pod
          replacement: $1
          action: replace
        - source_labels: [container_name]
          separator: ;
          regex: (.+)
          target_label: container
          replacement: $1
          action: replace

      - job_name: kube-state-metrics
        kubernetes_sd_configs:
        - role: endpoints
          namespaces:
            names:
            - monit
        relabel_configs:
        - source_labels: [__meta_kubernetes_service_label_app_kubernetes_io_name]
          regex: kube-state-metrics
          replacement: $1
          action: keep
        - action: labelmap
          regex: __meta_kubernetes_service_label_(.+)
        - source_labels: [__meta_kubernetes_namespace]
          action: replace
          target_label: k8s_namespace
        - source_labels: [__meta_kubernetes_service_name]
          action: replace
          target_label: k8s_sname

---
apiVersion: v1
kind: ConfigMap
metadata:
  name: prometheus-node
  namespace: monit
data:
  node.yml: |
    groups:
    - name: node
      rules:
      - alert: PrometheusEndpointDown
        expr: up == 0
        for: 10s
        labels:
          source: prometheus
        annotations:
          title: "Endpoint({{$labels.instance}}) Down"
          content: "The endpoint({{$labels.instance}}) of target({{$labels.job}}) has been down for more than 10 seconds."

---
apiVersion: apps/v1
kind: Deployment
metadata:
  name: prometheus-deployment
  namespace: monit
spec:
  replicas: 1
  selector:
    matchLabels:
      app: prometheus-deployment
  template:
    metadata:
      labels:
        app: prometheus-deployment
    spec:
      serviceAccountName: warlock
      securityContext:
        runAsUser: 0
      volumes:
      - name: config
        projected:
          sources:
          - configMap:
              name: prometheus-config
          - configMap:
              name: prometheus-node
      - name: data-vol
        hostPath:
          path: /opt/vol/prometheus/data
      containers:
      - name: prometheus
        image: prom/prometheus:v2.24.1
        imagePullPolicy: IfNotPresent # Always
        env:
        - name: TZ
          value: "Asia/Shanghai"
        volumeMounts:
        - name: config
          mountPath: "/etc/prometheus/prometheus.yml"
          subPath: prometheus.yml
          readOnly: true
        - name: config
          mountPath: "/etc/prometheus/node.yml"
          subPath: node.yml
          readOnly: true
        - name: data-vol
          mountPath: /prometheus
        ports:
          - containerPort: 9090
5.3 部署
# 执行编排脚本
cd /opt/yaml
kubectl apply -f prometheus.yaml


六、部署Grafana
6.1 创建数据持久化目录
mkdir -p /opt/vol/grafana
6.2 创建编排脚本
# 创建目录
mkdir -p /opt/yaml
# 创建编排脚本
vi /opt/yaml/grafana.yaml
将下面的内容保存到grafana.yaml中,wq保存。
apiVersion: v1
kind: Service
metadata:
  name: grafana-service
  namespace: monit
  labels:
    app: grafana-service
spec:
  type: NodePort
  ports:
  - port: 3000
    targetPort: 3000
    nodePort: 3000
  selector:
    app: grafana-deployment

---
apiVersion: v1
kind: PersistentVolume
metadata:
  name: grafana-pv
  namespace: monit
spec:
  capacity:
    storage: 10Gi
  accessModes:
    - ReadWriteOnce
  hostPath:
    path: "/opt/vol/grafana"

---
apiVersion: v1
kind: PersistentVolumeClaim
metadata:
  name: grafana-pvc
  namespace: monit
spec:
  accessModes:
  - ReadWriteOnce
  resources:
    requests:
      storage: "10Gi"

---
apiVersion: apps/v1
kind: Deployment
metadata:
  name: grafana-deployment
  namespace: monit
spec:
  replicas: 1
  selector:
    matchLabels:
      app: grafana-deployment
  template:
    metadata:
      labels:
        app: grafana-deployment
    spec:
      volumes:
      - name: grafana-pvc
        persistentVolumeClaim:
          claimName: grafana-pvc
      containers:
      - name: grafana
        image: grafana/grafana:7.4.1
        imagePullPolicy: IfNotPresent # Always
        env:
        - name: TZ
          value: "Asia/Shanghai"
        volumeMounts:
        - name: grafana-pvc
          mountPath: /var/lib/grafana
        ports:
          - containerPort: 3000
      initContainers:
      - name: init-chown-data
        image: busybox:1.33.0
        imagePullPolicy: IfNotPresent # Always
        command: ["chown", "-R", "472:472", "/var/lib/grafana"]
        volumeMounts:
          - name: grafana-pvc
            mountPath: /var/lib/grafana
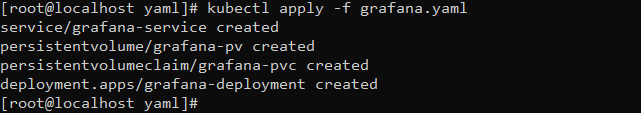
6.3 部署
# 执行编排脚本
cd /opt/yaml
kubectl apply -f grafana.yaml

6.4 登录grafana
使用初始用户名/密码(admin/admin)登录。

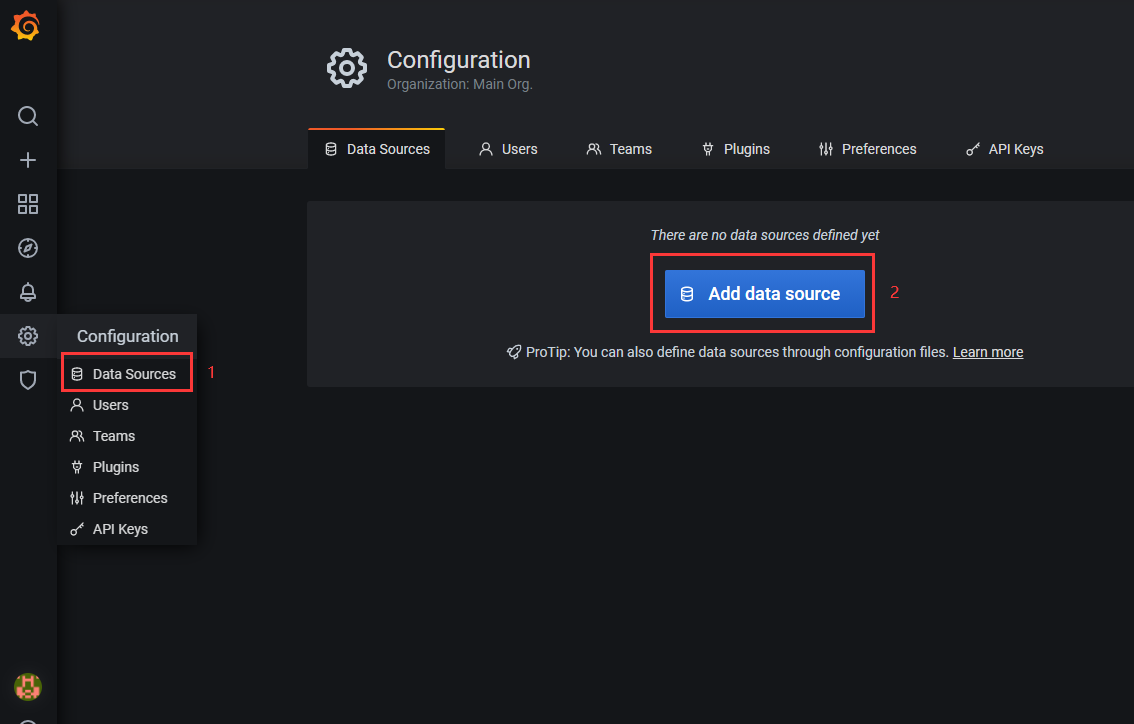
6.5 配置数据源
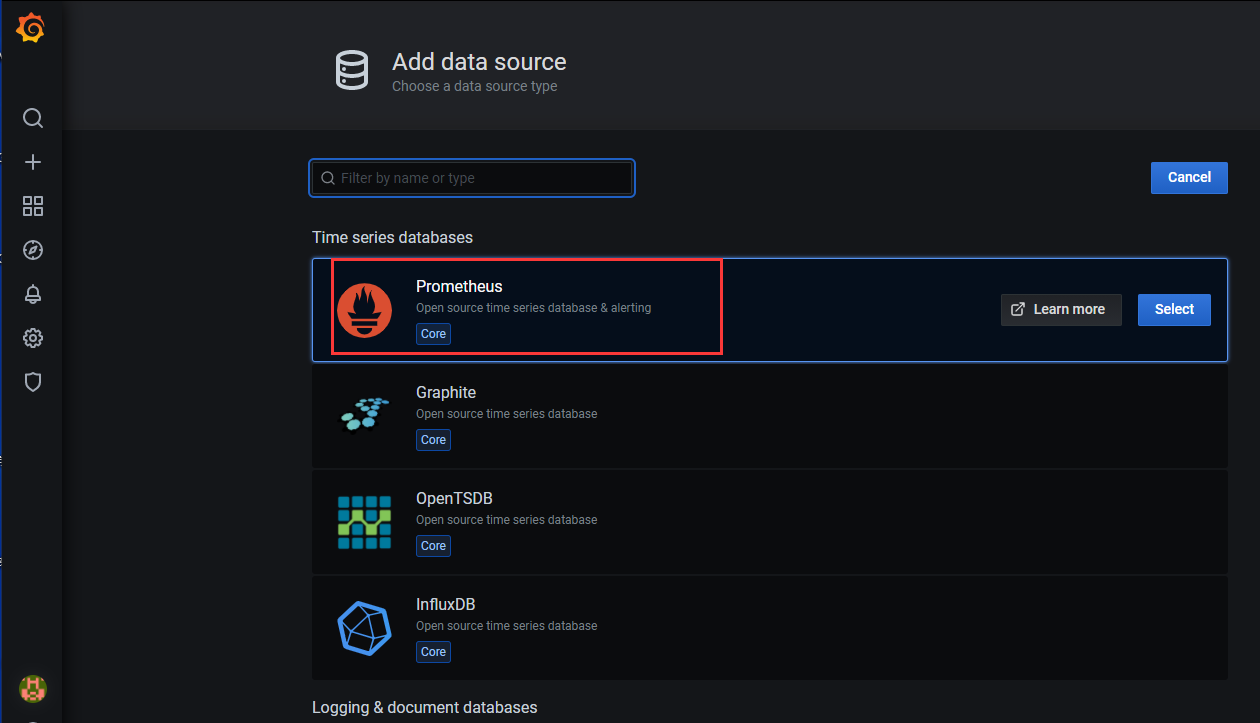
1)进入数据源信息的界面,点击“Add data source”
2)选择“Prometheus”
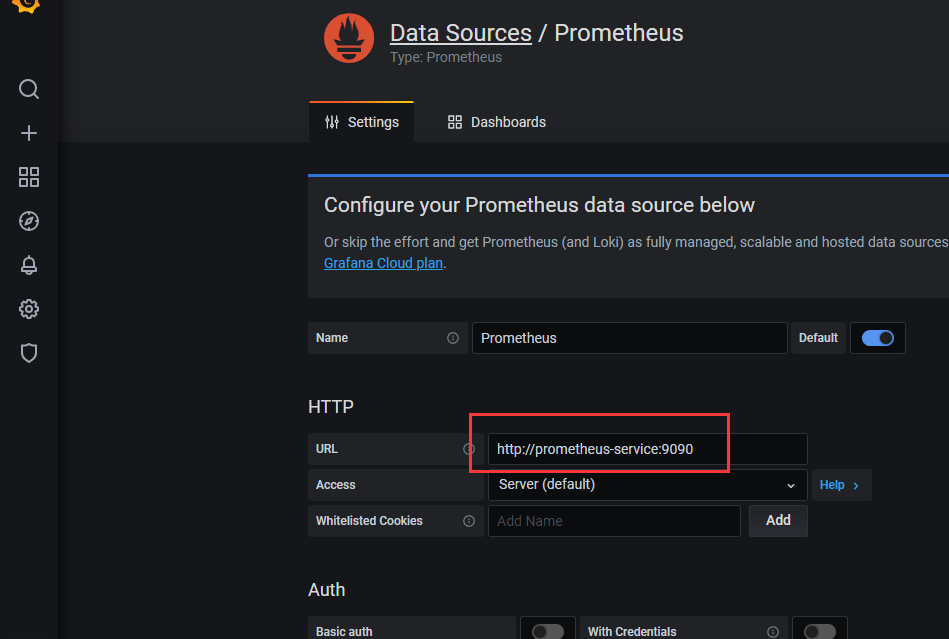
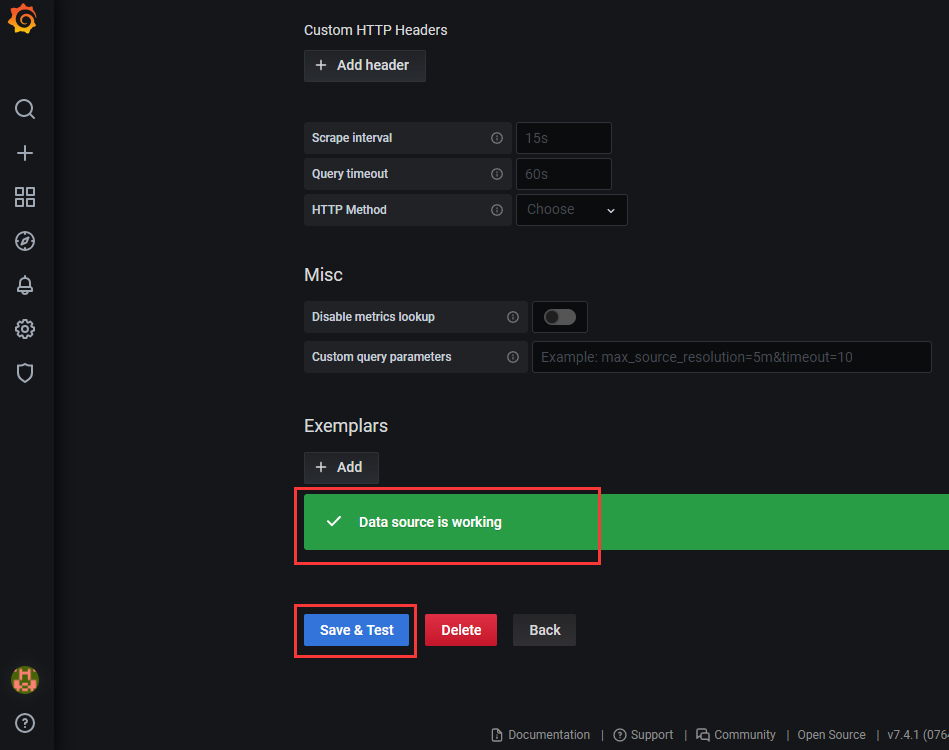
3)填写prometheus服务的URL,点击“Save & Test”(如果服务正常,则会提示)
6.6 导入仪表盘
选用的仪表盘模板(https://grafana.com/grafana/dashboards/13105)
由于作者使用的kube-state-metrics是v1.9.7,而查看文档(https://github.com/kubernetes/kube-state-metrics)只适用于1.16版本的kubernetes。
对于1.17以上的kubernetes使用的kube-state-metrics:v2.0.0-beta,查看日志2.x修改了部分参数。

直接使用原作者的仪表盘会导致很多数据无法呈现,故我对该仪表盘的某些参数针对最新版本的参数进行了修改后基本可以呈现数据,下面就针对修改后的仪表盘描述操作。
1)获取仪表盘文件
链接:https://pan.baidu.com/s/1BYnaczAeIRuJAK6LI8T7GQ
提取码:vvcp
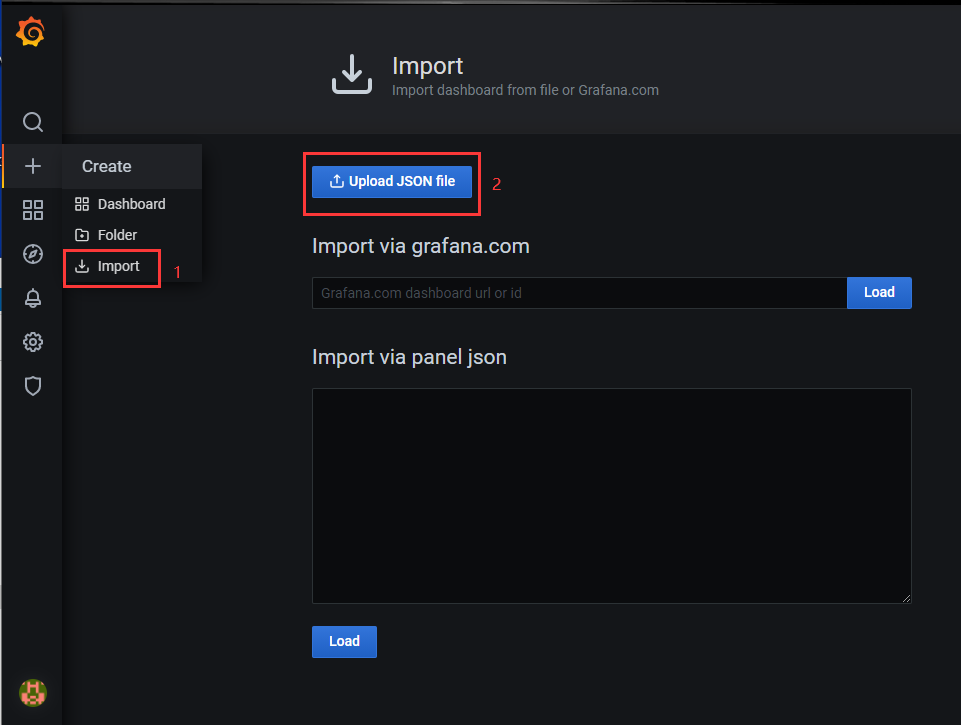
2)导入该文件
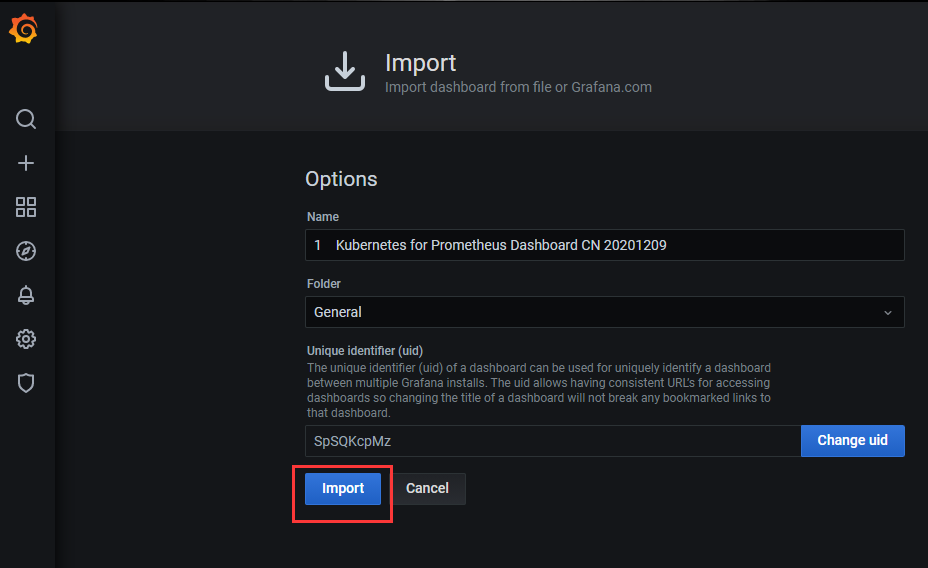
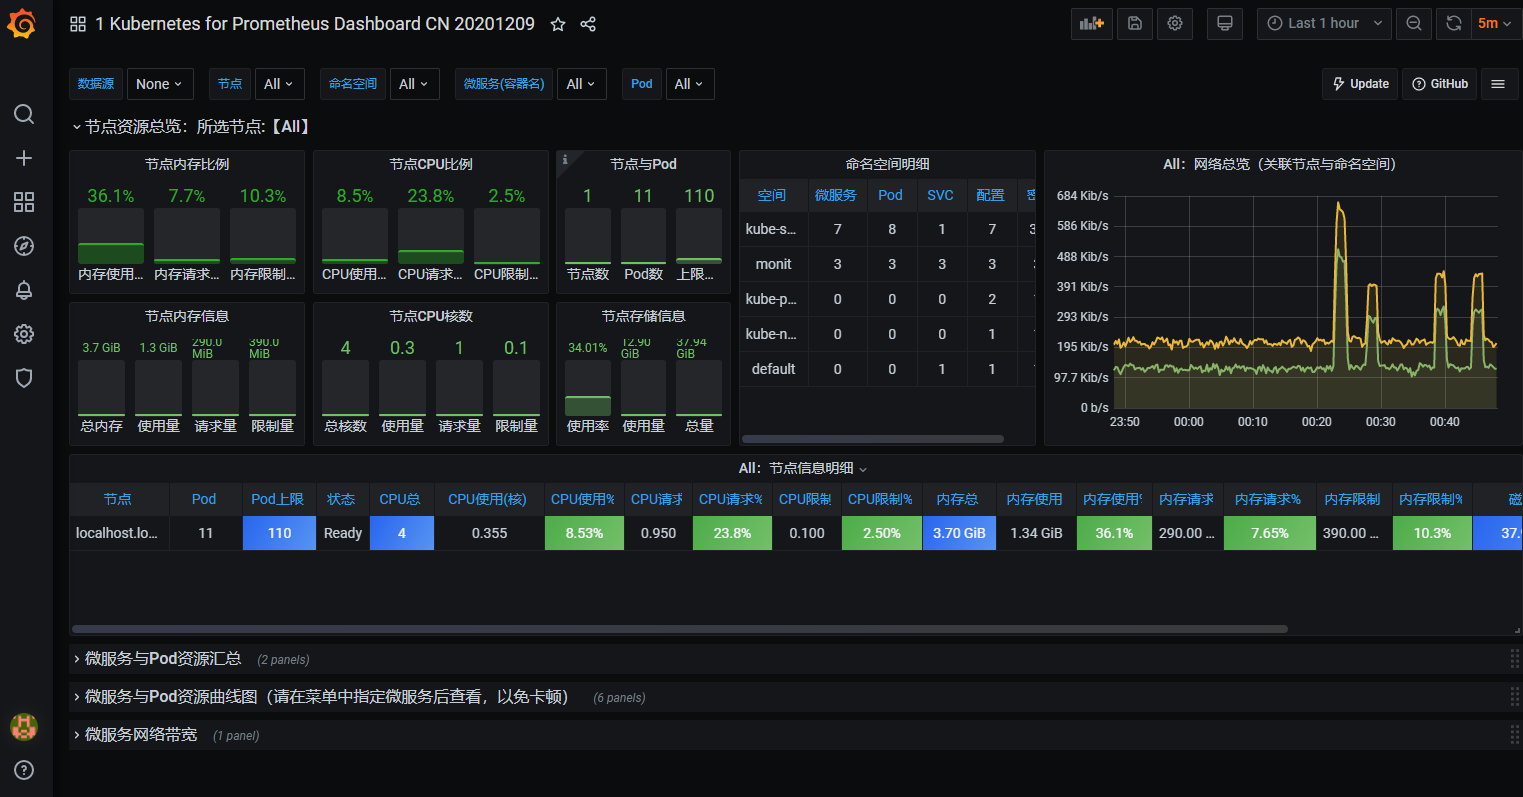
3)查看
七、部署

7.2 创建编排脚本
# 创建目录
mkdir -p /opt/yaml
# 创建编排脚本
vi /opt/yaml/alertmanager.yaml
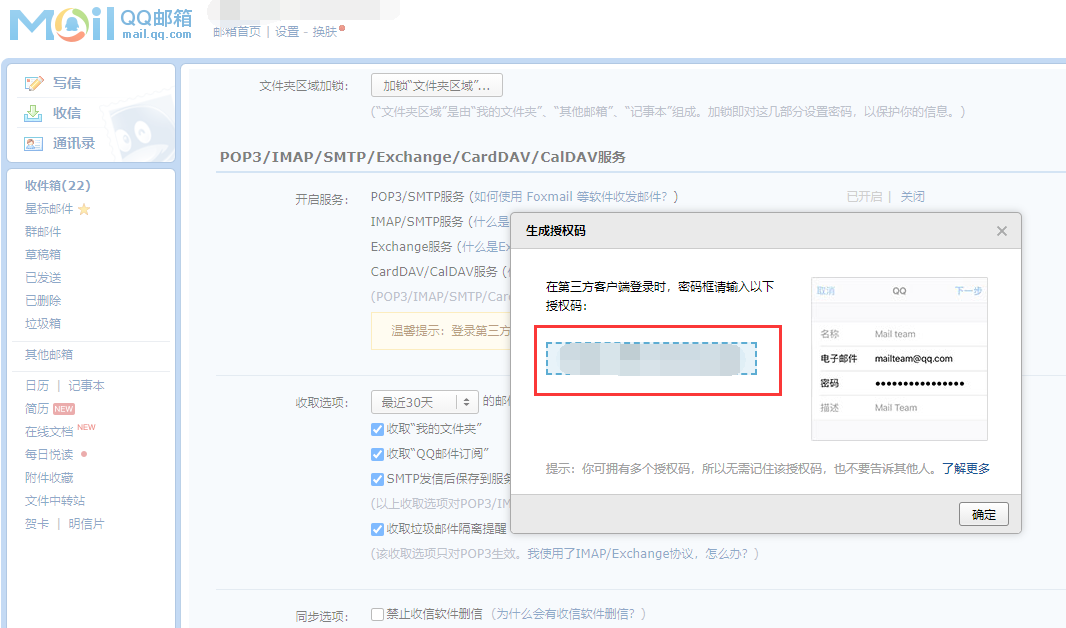
# 修改邮箱相关的配置,将下面的内容保存到alertmanager.yaml中,wq保存。
apiVersion: v1
kind: ConfigMap
metadata:
  name: alertmanager-config
  namespace: monit
data:
  alertmanager.yml: |
    global:
      resolve_timeout: 5m
      smtp_smarthost: '<smtp服务器:端口>'
      smtp_from: '<发件邮箱>'
      smtp_auth_username: '<发件邮箱>'
      smtp_auth_password: '<邮箱授权码>'
      smtp_require_tls: false

    route:
      group_by: ['alertname']
      group_wait: 30s
      group_interval: 30s
      repeat_interval: 1h
      receiver: 'mail'

    receivers:
    - name: 'mail'
      email_configs:
      - to: '<收件邮箱>'

---
apiVersion: v1
kind: Service
metadata:
  name: alertmanager-service
  namespace: monit
  labels:
    app: alertmanager-service
    kubernetes.io/cluster-service: "true"
    addonmanager.kubernetes.io/mode: EnsureExists
spec:
  type: NodePort
  ports:
  - port: 9093
    targetPort: 9093
    nodePort: 9093
  selector:
    app: alertmanager-deployment

---
apiVersion: apps/v1
kind: Deployment
metadata:
  name: alertmanager-deployment
  namespace: monit
spec:
  replicas: 1
  selector:
    matchLabels:
      app: alertmanager-deployment
  template:
    metadata:
      labels:
        app: alertmanager-deployment
    spec:
      volumes:
      - name: config
        configMap:
          name: alertmanager-config
      containers:
      - name: alertmanager
        image: prom/alertmanager:v0.21.0
        imagePullPolicy: IfNotPresent # Always
        env:
        - name: TZ
          value: "Asia/Shanghai"
        volumeMounts:
        - name: config
          mountPath: "/etc/alertmanager"
          readOnly: true
        ports:
          - containerPort: 9093
7.3 部署
# 执行编排脚本
cd /opt/yaml
kubectl apply -f alertmanager.yaml


7.4 模拟触发告警
在之前的prometheus配置中,增加了一个告警规则(如果有目标服务挂了,进行告警)
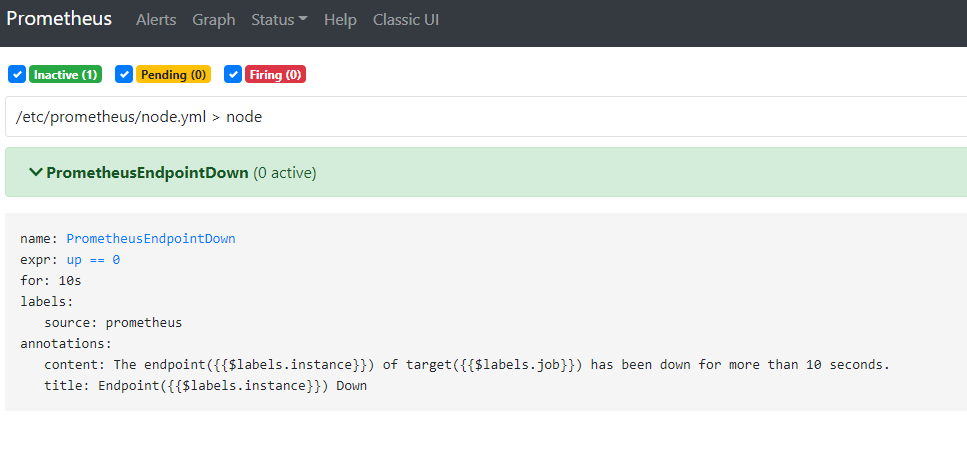
接着通过更换不存在的kube-state-metrics镜像,来触发该告警规则。
# 拷贝一份试验用的yaml脚本
cd /opt/yaml
cp kube-state-metrics.yaml kube-state-metrics-test.yaml
# 更换不存在的镜像
cd /opt/yaml
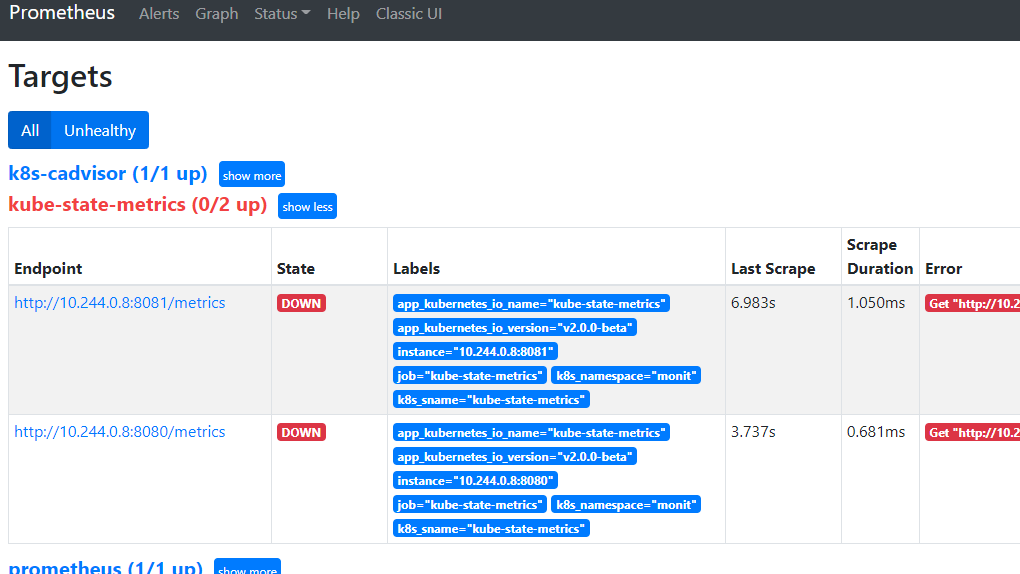
sed -i 's/kube-state-metrics:v2.0.0-beta$/kube-state-metrics:abcd/g' kube-state-metrics-test.yaml
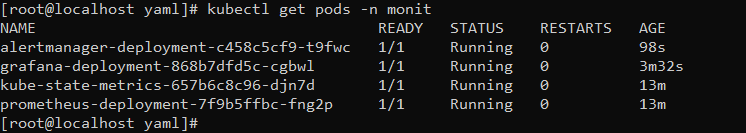
# 重新部署kube-state-metrics
cd /opt/yaml
kubectl delete -f kube-state-metrics.yaml
kubectl create -f kube-state-metrics-test.yaml
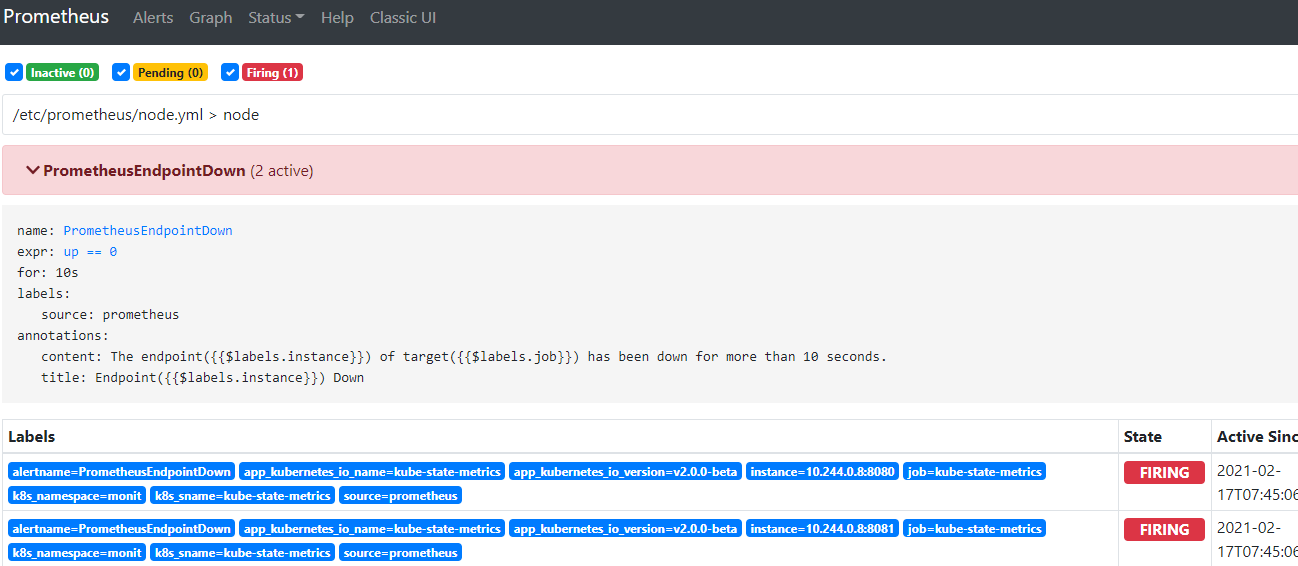
由于拉取不到这个tag为abcd的镜像,故该服务的pod无法启动,于是触发告警规则。
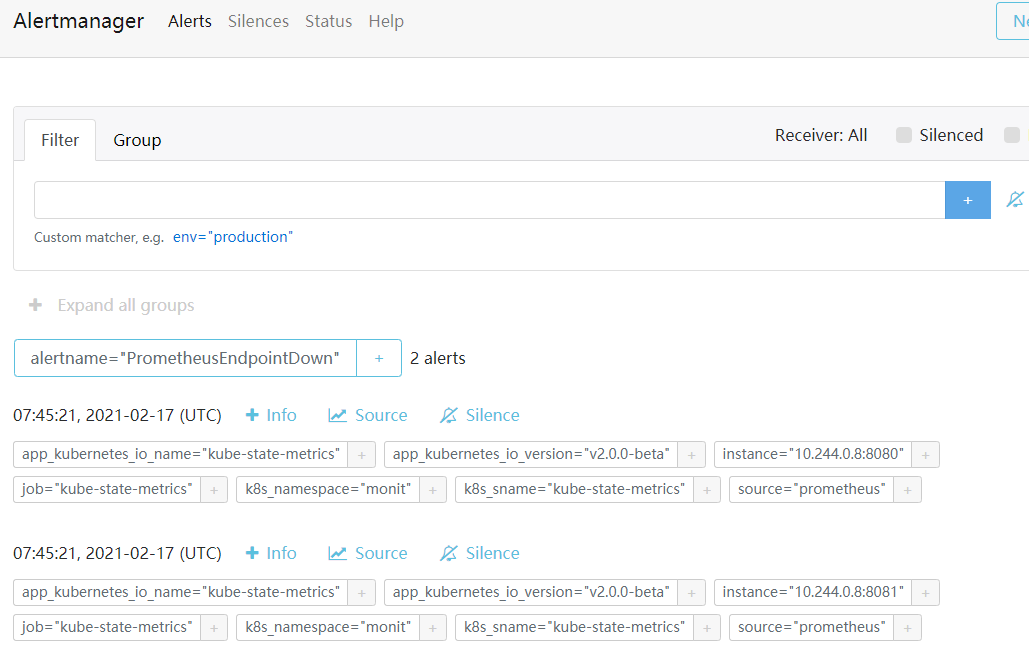
目标邮箱就会收到告警邮件如下:
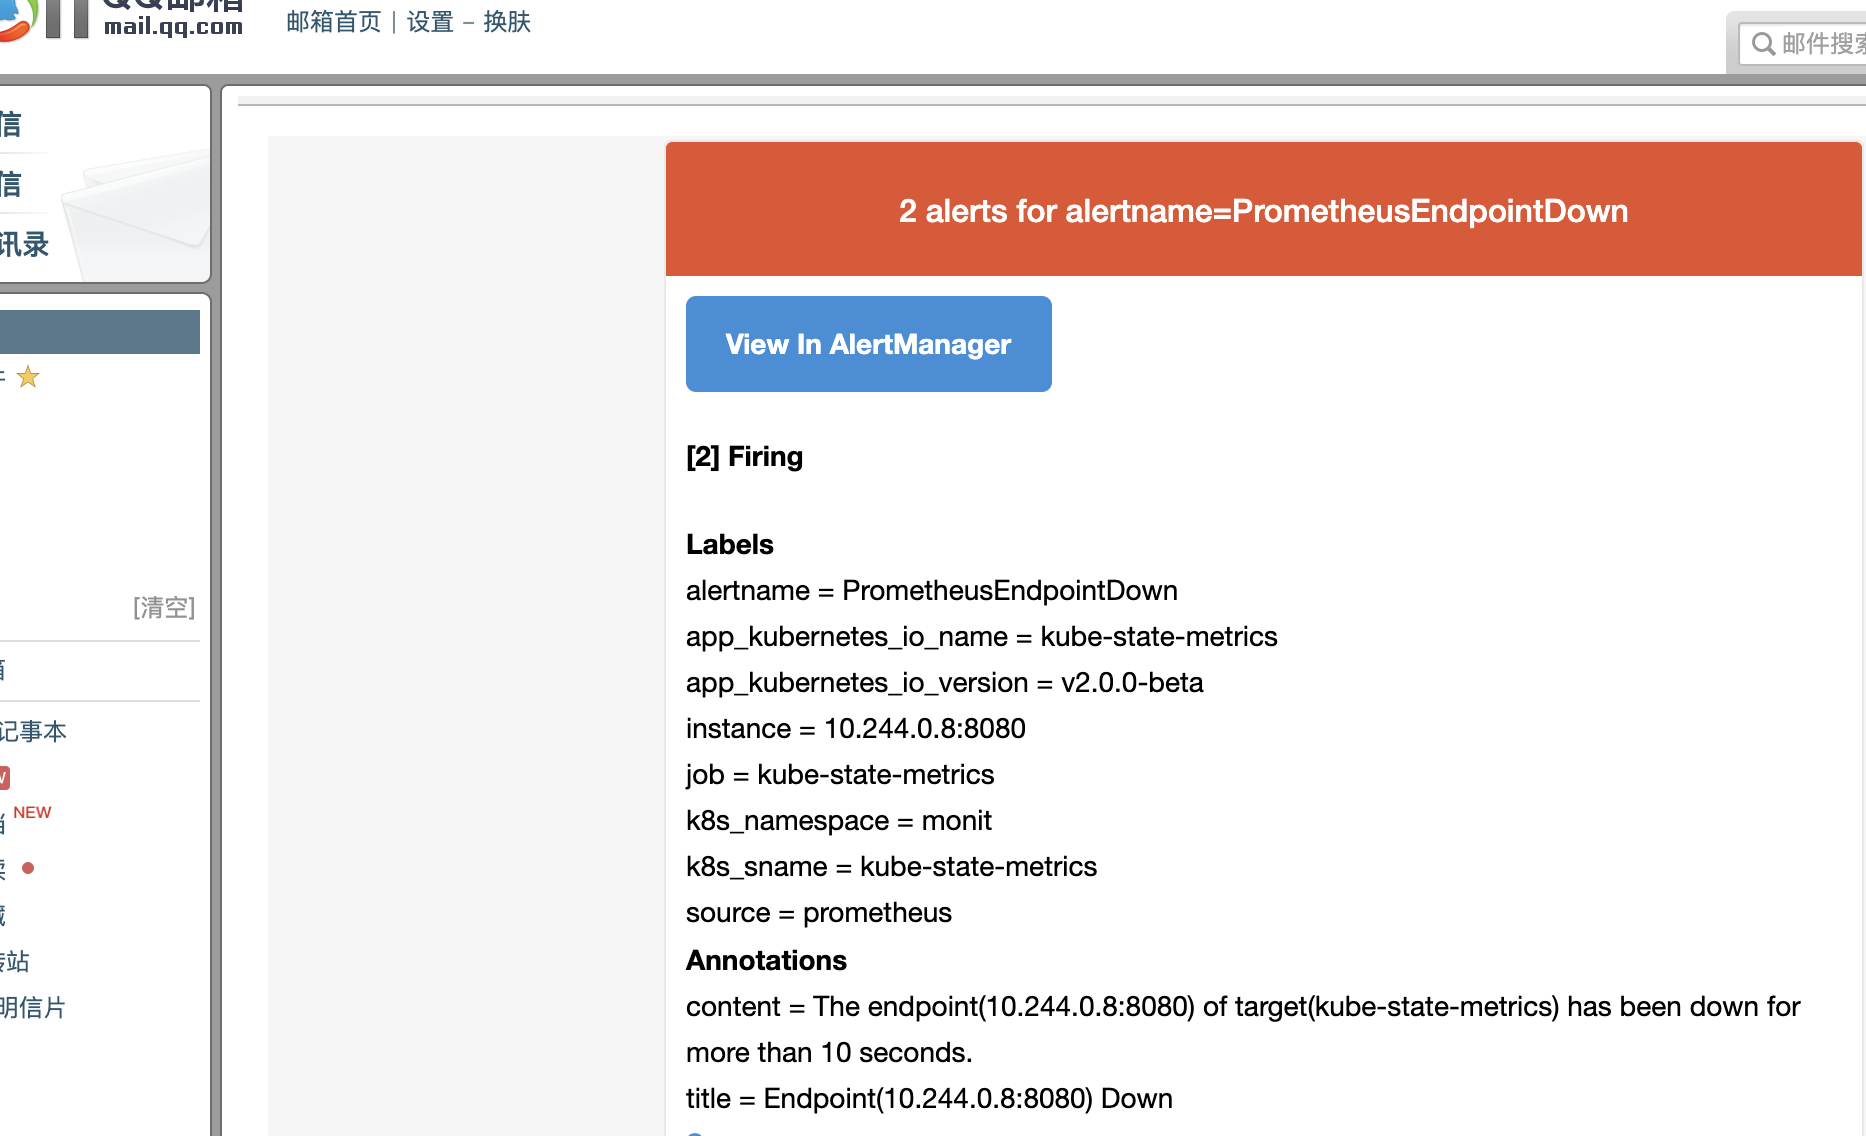
这样整个监控容器与集群参数的demo基本就已经实现,应用于项目还得根据实际选择需要的参数和规则进行配置。