为方便问题发生后,问题原因的分析排查,我们可以在服务器中事先部署如下脚本,方便故障发生后,问题原因的分析排查
脚本部署方法:
1.将脚本【top_monitor.sh】上传到服务器
2.登陆虚拟机,并切换到root用户
3.执行命令: chmod +x <path>/top_monitor.sh 【<path>替换成实际脚本上传的目录】
4.执行命令:crontab -e
5.添加定时任务:* * * * * <the path of the script>/top_monitor.sh <the path of ouputs saved> <keeps>
备注:
范例:* * * * * /root/top_monitor.sh /var/tmp/ 72 &
a.这里的keeps以小时为单位,如果保留三天的话,就输入72
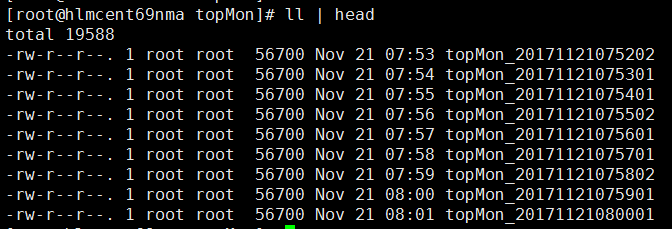
b.该脚本每五秒钟收集一次top/vmstat/iostat命令的输出,每分钟会生成一个性能数据文件
c.不要把用户数据放到该目录下,否则会被清理掉
6.搜集到的性能日志格式如下:
2017-11-22 07:07:01
top - 07:07:01 up 1 day, 36 min,  2 users,  load average: 0.00, 0.00, 0.00
Tasks: 163 total,   1 running, 159 sleeping,   0 stopped,   3 zombie
Cpu(s):  1.0%us,  0.5%sy,  0.0%ni, 98.2%id,  0.3%wa,  0.0%hi,  0.0%si,  0.0%st
Mem:   3530640k total,   778368k used,  2752272k free,   127976k buffers
Swap:        0k total,        0k used,        0k free,   352288k cached

  PID USER      PR  NI  VIRT  RES  SHR S %CPU %MEM    TIME+  COMMAND
   12 root      20   0     0    0    0 S  1.9  0.0   0:07.04 events/1
    1 root      20   0 21388 1528 1204 S  0.0  0.0   0:07.80 init
    2 root      20   0     0    0    0 S  0.0  0.0   0:00.01 kthreadd
    3 root      RT   0     0    0    0 S  0.0  0.0   0:02.09 migration/0
    4 root      20   0     0    0    0 S  0.0  0.0   0:00.79 ksoftirqd/0
    5 root      RT   0     0    0    0 S  0.0  0.0   0:00.00 stopper/0
    6 root      RT   0     0    0    0 S  0.0  0.0   0:00.13 watchdog/0
    7 root      RT   0     0    0    0 S  0.0  0.0   0:02.19 migration/1
    8 root      RT   0     0    0    0 S  0.0  0.0   0:00.00 stopper/1
    9 root      20   0     0    0    0 S  0.0  0.0   0:00.80 ksoftirqd/1
   10 root      RT   0     0    0    0 S  0.0  0.0   0:00.13 watchdog/1
   11 root      20   0     0    0    0 S  0.0  0.0   0:04.85 events/0
   13 root      20   0     0    0    0 S  0.0  0.0   0:00.00 events/0
   14 root      20   0     0    0    0 S  0.0  0.0   0:00.00 events/1
   15 root      20   0     0    0    0 S  0.0  0.0   0:00.00 events_long/0
   16 root      20   0     0    0    0 S  0.0  0.0   0:00.00 events_long/1
   17 root      20   0     0    0    0 S  0.0  0.0   0:00.00 events_power_ef
   18 root      20   0     0    0    0 S  0.0  0.0   0:00.00 events_power_ef
   19 root      20   0     0    0    0 S  0.0  0.0   0:00.00 cgroup
   20 root      20   0     0    0    0 S  0.0  0.0   0:00.00 khelper
   21 root      20   0     0    0    0 S  0.0  0.0   0:00.00 netns
   22 root      20   0     0    0    0 S  0.0  0.0   0:00.00 async/mgr
   23 root      20   0     0    0    0 S  0.0  0.0   0:00.00 pm
   24 root      20   0     0    0    0 S  0.0  0.0   0:00.39 sync_supers
   25 root      20   0     0    0    0 S  0.0  0.0   0:00.06 bdi-default
   26 root      20   0     0    0    0 S  0.0  0.0   0:00.00 kintegrityd/0
procs -----------memory---------- ---swap-- -----io---- --system-- -----cpu-----
 r  b   swpd   free   buff  cache   si   so    bi    bo   in   cs us sy id wa st
 1  0      0 2752396 127976 352288    0    0     2    49   58   53  1  1 98  0  0
Linux 2.6.32-696.3.2.el6.x86_64 (hlmcent69nma)  11/22/2017      _x86_64_        (2 CPU)

avg-cpu:  %user   %nice %system %iowait  %steal   %idle
           1.00    0.00    0.52    0.27    0.00   98.20

Device:         rrqm/s   wrqm/s     r/s     w/s   rsec/s   wsec/s avgrq-sz avgqu-sz   await r_await w_await  svctm  %util
sdc               0.00     0.00    0.00    0.00     0.03     0.00     8.02     0.00    1.88    1.88    0.00   1.88   0.00
sdb               0.00     6.55    0.01    0.08     0.09  3249.50 37296.35     0.00   13.02    0.60   14.82   0.50   0.00
sda               0.04    15.12    0.12    2.52     6.35   141.07    55.83     0.01    4.93    6.92    4.83   3.29   0.87
脚本详情如下:
#! /bin/bash

if [ $# != 2 ]; then
        echo "Invalid option, try top_monitor.sh <path> <hours>"
        exit
fi

export dir=$1
export keeps=$2

## Create topMon folder
if [ ! -d "$dir" ]; then
	mkdir $dir
fi

mkdir $dir/topMon

file=$dir/topMon/"topMon_"`date +%Y%m%d`
file=$dir/topMon/"topMon_"`date +%Y%m%d%H%M%S`

## Cleanup expired outputs
for i in `find $dir/topMon/ -type f -atime +$keeps -print`
#for i in `find $dir/topMon/ -type f -amin +$keeps -print`
do
rm -rf $i
done

## Record top ouputs
for i in {0..10}
do
date +"%Y-%m-%d %H:%M:%S" >> $file
top -b -n 1 | head -33 >> $file
vmstat >> $file
iostat -x 1 1 >> $file
sleep 5
done