• vue使用echarts系列之K线图Candlestick


    主要是对配置的一些说明,项目源码githup地址https://github.com/shengbid/echarts-series

    看一下option的配置,除去series里面的配置,其他属性都是常见的配置,不多展开
    option: {
            title: {
              text: '上证指数',
              left: 0
            },
            tooltip: {
              trigger: 'axis',
              axisPointer: {
                  type: 'cross'
              }
            },
            legend: {
              data: ['日K', 'MA5', 'MA10', 'MA20', 'MA30']
            },
            grid: {
              left: '10%',
              right: '10%',
              bottom: '15%'
            },
            xAxis: {
              type: 'category',
              data: [],
              scale: true,
              boundaryGap: false,
              axisLine: {onZero: false},
              splitLine: {show: false},
              splitNumber: 20,
              min: 'dataMin',
              max: 'dataMax'
            },
            yAxis: {
              scale: true,
              splitArea: {
                  show: true
              }
            },
            dataZoom: [
              {
                  type: 'inside',
                  start: 50,
                  end: 100
              },
              {
                  show: true,
                  type: 'slider',
                  top: '90%',
                  start: 50,
                  end: 100
              }
            ],
    }
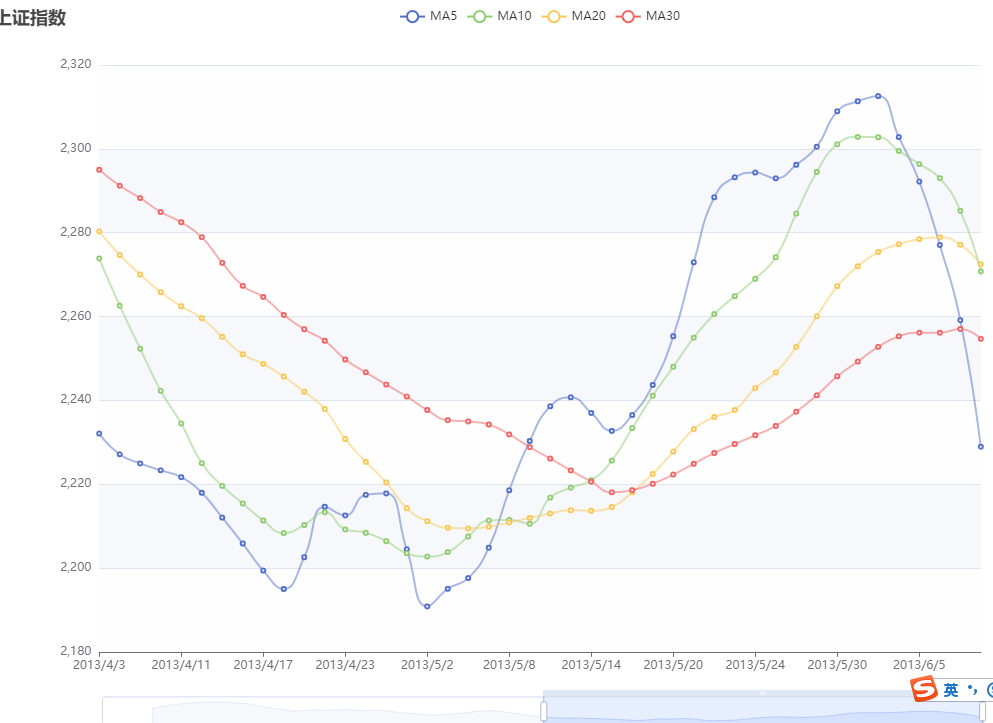
    主要看一下series配置里面的K线图,其他4组数据就是普通的折线图,先看一个注释掉K线图的效果,就是简单的多条折线图
     
    OK,现在把其他4组数据注释,只留下K线图,就是现在这样
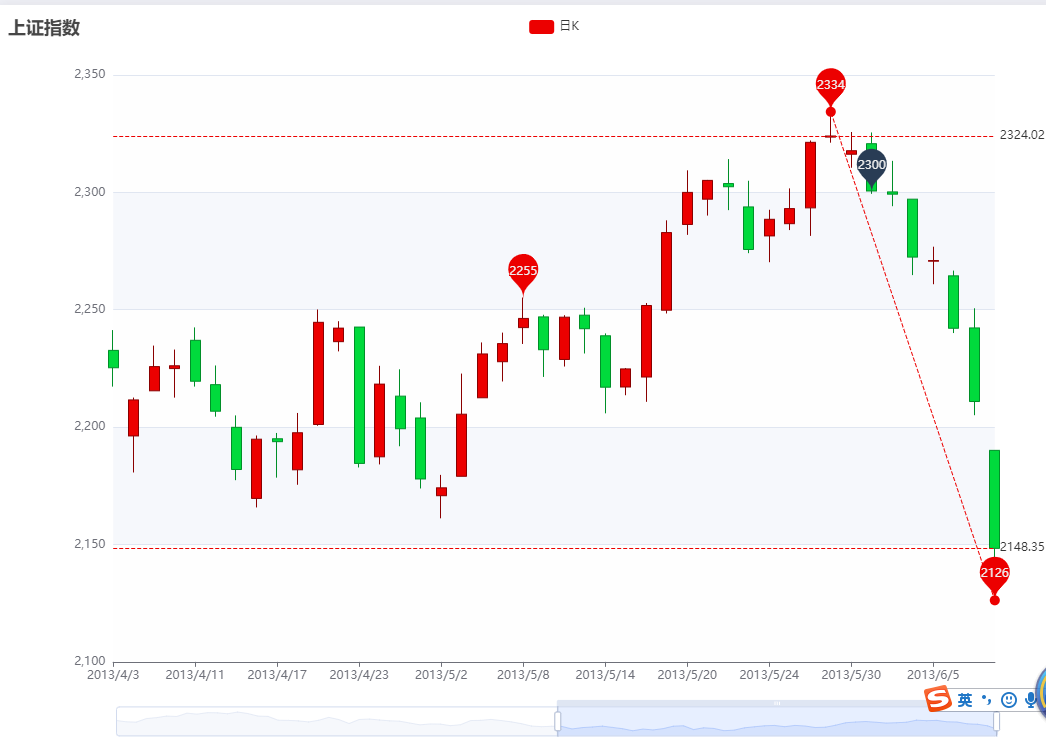
     
    然后详细说明一下这里面的配置

    data: k线图数据,格式[open, close, lowest, highest] (即:[开盘值, 收盘值, 最低值, 最高值])  示例: data: [[11, 22, 33, 44], [12, 23, 34, 45]....]

    itemStyle: 单个 K 线图数据的图形样式,默认阳线红色,阴线绿色
    itemStyle: {
                    color: '#ec0000', // 阳线颜色
                    color0: '#00da3c', // 阴线颜色
                    borderColor: '#8A0000', // 阳线边框颜色
                    borderColor0: '#008F28' // 阴线边框颜色
                },
     
    markPoint: 图表标注,就是图上4个圈圈标注
    markPoint: {data: []}
    data: [ // 有几组数据就有几个标注
            {
                name: 'XX标点', // 标注名称,可不填,不会展示出来
                coord: ['2013/5/31', 2300], // 标注的坐标X轴, Y轴
                value: 2300, // 标注的数字
                itemStyle: {
                    color: 'rgb(41,60,85)' // 标注的颜色
                }
            },
            {
                name: 'highest value',
                // 特殊的标注类型,用于标注最大值最小值等
                // 'min' 最小值。
                // 'max' 最大值。
                // 'average' 平均值
                type: 'max', 
                valueDim: 'highest' // K线图的取值维度open, close, lowest, highest
            },
            {
                name: 'lowest value',
                type: 'min',
                valueDim: 'lowest'
            },
            {
                name: 'average value on close',
                type: 'average',
                valueDim: 'close'
            }
        ],
     
     
    markLine: 图表标线,就是图上三条虚线
    markLine: {
          symbol: ['none', 'none'], // 线段两端的图表,默认开始是圆圈,结束是箭头
          data: [
              [ // 数组格式可以有两个值,表示线段的起点和终点
                {
                    name: 'from lowest to highest',
                    type: 'min',
                    valueDim: 'lowest', // K线图的取值维度open, close, lowest, highest
                    symbol: 'circle',
                    symbolSize: 10,
                    label: {
                        show: false
                    },
                    emphasis: {
                        label: {
                            show: false
                        }
                    }
                },
                {
                    type: 'max',
                    valueDim: 'highest',
                    symbol: 'circle',
                    symbolSize: 10,
                    label: {
                        show: false
                    },
                    emphasis: {
                        label: {
                            show: false
                        }
                    }
                  }
              ],
              { // 对象形式为直线
                  name: 'min line on close',
                  type: 'min',
                  valueDim: 'close'
              },
              {
                  name: 'max line on close',
                  type: 'max',
                  valueDim: 'close'
              }
          ]
        }

    完整代码,vue

    <template>
      <div class="container">
        <div class="chart-container">
          <div id="lineChart" style="900px;height:500px"></div>
        </div>
      </div>
    </template>
    
    <script>
    import data from './chartdata/candlestickdata' // 图表数据
    
    export default {
      name: 'candlestickChart',
      data() {
        return {
          option: {
            title: {
              text: '上证指数',
              left: 0
            },
            tooltip: {
              trigger: 'axis',
              axisPointer: {
                  type: 'cross'
              }
            },
            legend: {
              data: ['日K', 'MA5', 'MA10', 'MA20', 'MA30']
            },
            grid: {
              left: '10%',
              right: '10%',
              bottom: '15%'
            },
            xAxis: {
              type: 'category',
              data: [],
              scale: true,
              boundaryGap: false,
              axisLine: {onZero: false},
              splitLine: {show: false},
              splitNumber: 20,
              min: 'dataMin',
              max: 'dataMax'
            },
            yAxis: {
              scale: true,
              splitArea: {
                  show: true
              }
            },
            dataZoom: [
              {
                  type: 'inside',
                  start: 50,
                  end: 100
              },
              {
                  show: true,
                  type: 'slider',
                  top: '90%',
                  start: 50,
                  end: 100
              }
            ],
            series: [
              {
                name: '日K',
                type: 'candlestick',
                data: [],
                itemStyle: {
                    color: '#ec0000',
                    color0: '#00da3c',
                    borderColor: '#8A0000',
                    borderColor0: '#008F28'
                },
                markPoint: {
                    label: {
                        formatter: function (param) {
                            return param != null ? Math.round(param.value) : '';
                        }
                    },
                    data: [
                        {
                            name: 'XX标点',
                            coord: ['2013/5/31', 2300],
                            value: 2300,
                            itemStyle: {
                                color: 'rgb(41,60,85)'
                            }
                        },
                        {
                            name: 'highest value',
                            type: 'max',
                            valueDim: 'highest'
                        },
                        {
                            name: 'lowest value',
                            type: 'min',
                            valueDim: 'lowest'
                        },
                        {
                            name: 'average value on close',
                            type: 'average',
                            valueDim: 'close'
                        }
                    ],
                    tooltip: {
                        formatter: function (param) {
                            return param.name + '<br>' + (param.data.coord || '');
                        }
                    }
                },
                markLine: {
                  symbol: ['none', 'none'],
                  data: [
                      [
                        {
                            name: 'from lowest to highest',
                            type: 'min',
                            valueDim: 'lowest',
                            symbol: 'circle',
                            symbolSize: 10,
                            label: {
                                show: false
                            },
                            emphasis: {
                                label: {
                                    show: false
                                }
                            }
                        },
                        {
                            type: 'max',
                            valueDim: 'highest',
                            symbol: 'circle',
                            symbolSize: 10,
                            label: {
                                show: false
                            },
                            emphasis: {
                                label: {
                                    show: false
                                }
                            }
                          }
                      ],
                      {
                          name: 'min line on close',
                          type: 'min',
                          valueDim: 'close'
                      },
                      {
                          name: 'max line on close',
                          type: 'max',
                          valueDim: 'close'
                      }
                  ]
                }
              },
              {
                name: 'MA5',
                type: 'line',
                data: [],
                smooth: true,
                lineStyle: {
                    opacity: 0.5
                }
              },
              {
                name: 'MA10',
                type: 'line',
                data: [],
                smooth: true,
                lineStyle: {
                    opacity: 0.5
                }
              },
              {
                name: 'MA20',
                type: 'line',
                data: [],
                smooth: true,
                lineStyle: {
                    opacity: 0.5
                }
              },
              {
                name: 'MA30',
                type: 'line',
                data: [],
                smooth: true,
                lineStyle: {
                    opacity: 0.5
                }
              },
            ]
          },
          lineChart: null,
          candleData: {
            categoryData: [],
            values: []
          }
        }
      },
      mounted() {
        this.candleData = this.splitData(data)
        console.log(this.candleData)
        this.option.xAxis.data = this.candleData.categoryData
        this.option.series[0].data = this.candleData.values
        this.option.series[1].data = this.calculateMA(5)
        this.option.series[2].data = this.calculateMA(10)
        this.option.series[3].data = this.calculateMA(20)
        this.option.series[4].data = this.calculateMA(30)
        this.getLineChart()
      },
      methods: {
         // 设置折线图
        getLineChart() {
          this.lineChart = this.$echart.init(document.getElementById('lineChart'))
          this.lineChart.setOption(this.option)
        },
        splitData(rawData) {
          var categoryData = [];
          var values = []
          for (var i = 0; i < rawData.length; i++) {
              categoryData.push(rawData[i].splice(0, 1)[0]);
              values.push(rawData[i])
          }
          return {
              categoryData: categoryData,
              values: values
          }
        },
        calculateMA(dayCount) {
          var result = [];
          for (var i = 0, len = this.candleData.values.length; i < len; i++) {
              if (i < dayCount) {
                  result.push('-');
                  continue;
              }
              var sum = 0;
              for (var j = 0; j < dayCount; j++) {
                  sum += this.candleData.values[i - j][1]
              }
              result.push(sum / dayCount)
          }
          return result
        }
      }
    }
    </script>
    
    <style lang="less">
    
    </style>

    echarts系列文章:

    vue-cli使用echarts系列之涟漪效果地图effectScatterhttps://www.cnblogs.com/steamed-twisted-roll/p/14379169.html

    vue-cli使用echarts系列之地图type: map https://www.cnblogs.com/steamed-twisted-roll/p/14378535.html

  • 相关阅读:
    初识python 2.x与3.x 区别
    装饰器
    函数的进阶
    Spring Boot启动问题:Cannot determine embedded database driver class for database type NONE
    22.Spring Cloud Config安全保护
    23.Spring Cloud Bus 无法更新问题(踩坑) Spring cloud config server Could not fetch remote for master remote
    24.Spring Cloud之Spring Cloud Config及Spring Cloud Bus
    Spring Boot整合Spring Data Elasticsearch 踩坑
    项目中Spring Security 整合Spring Session实现记住我功能
    32.再谈SpringBoot文件上传
  • 原文地址:https://www.cnblogs.com/steamed-twisted-roll/p/14368766.html
Copyright © 2020-2023  润新知