补充:查找手册https://developer.mozilla.org/en-US/
一:WebRTC中的RTP/RTCP模块
(一)RTP/RTCP简介
RTP/RTCP协议是流媒体通信的基石。RTP协议定义流媒体数据在互联网上传输的数据包格式,而RTCP协议则负责可靠传输、流量控制和拥塞控制等服务质量保证。
在WebRTC项目中,RTP/RTCP模块作为传输模块的一部分,负责对发送端采集到的媒体数据进行进行封包,然后交给上层网络模块发送;
在接收端RTP/RTCP模块收到上层模块的数据包后,进行解包操作,最后把负载发送到解码模块。
因此,RTP/RTCP 模块在WebRTC通信中发挥非常重要的作用。
(二)RTP Media(webrtc中真正处理数据传输的模块)
在RTP Media中有两个重要的类:Receiver与Sender
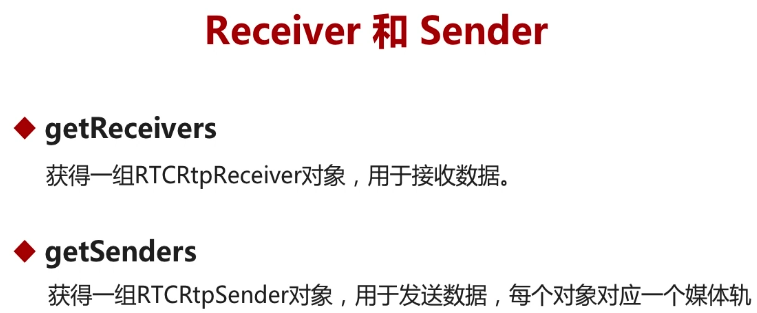
每一个媒体轨都会对应一个对会对应一个Receiver对象(接收时)和一个Sender对象(发送时)
(三)RTCRtpReceiver与RTCRtpSender属性一致(3种)
以RTCRtpReceiver为例:
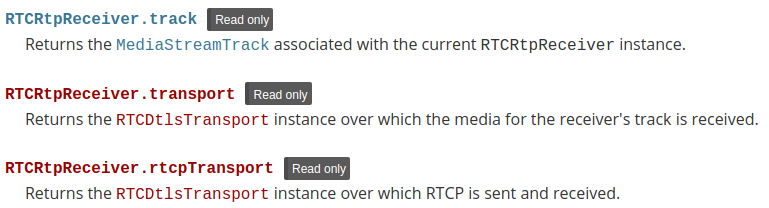
RTCRtpReceiver.track:返回与当前RTCRtpReceiver实例关联的MediaStreamTrack
通过媒体轨属性可以获取当前轨的类型,是audio/video
RTCRtpReceiver.transport:返回接收到的接收者媒体轨的RTCDTLTransport实例
存放着媒体数据传输相关的属性,其中trnasport用于媒体数据的传输,媒体流通过底层的transport进行传输。transport可以进行复用,多个媒体轨复用一个transport传输!
RTCRtpReceiver.rtcpTransport:返回发送和接收RTCP的RTCDTLTransport实例
与rtcp传输相关的属性,比如传输抖动,丢包数量、延迟....。接受方进行统计,反馈给发送端,发送方根据这些数据进行网络质量的评估,适当调整网络流量的发送,这就是流量控制
(四)RTCRtpReceiver实例的方法(5种)
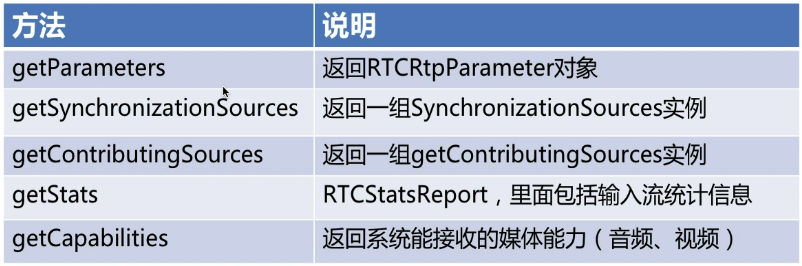
getParameters:返回一个RTCRtpParameters对象,其中包含有关如何解码RTP数据的信息。
方法返回一个RTCRtpReceiveParameters对象,该对象描述了在接收轨上面的媒体关于编码和传输的配置。
对于第2、3个方法,先查看RTP头部格式:
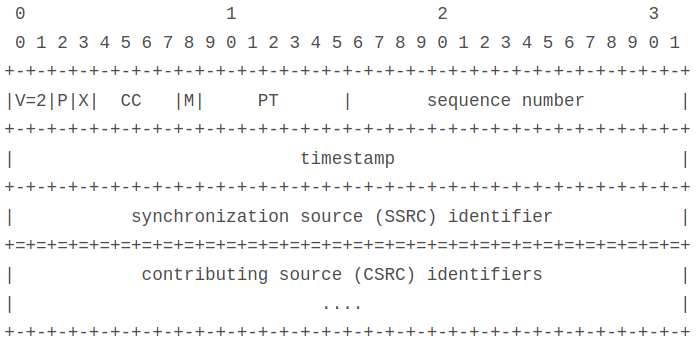
getSynchronizationSources: 方法返回一个RTCRTPContributionSource实例数组,每个实例对应于当前RTCRtpReceiver在最近10秒内接收到的一个SSRC(同步源)标识符。
返回了一组RTCRtpSynchronizationSource实例,每个实例描述在过去10秒内向传入流提供数据的一个同步源。它继承了RTCRtpContributingSource的属性,包括时间戳、源和音频级别。同步源对象添加了voiceActivityFlag属性,该属性指示接收到的最后一个RTP数据包是否包含语音活动。
getContributingSources:方法返回一个RTCRtpContributingSource实例数组,每个实例对应于当前RTCRtpReceiver在最近10秒内接收到的一个CSRC(贡献源)标识符。
每个实例描述了在过去10秒内向传入流提供数据的一个贡献源。
getStats:异步请求一个RTCStatsReport对象,该对象提供有关所属RTCPeerConnection上传入流量的统计信息,并返回一个Promise,一旦结果可用,将调用该Promise的异步处理程序。
getCapabilities:返回一个RTCRtpCapabilities对象,描述当前设备上RTCRtpReceiver支持的编解码器和功能。类似地,您可以通过调用静态函数RTCRtpSender.getCapabilities()来获取RTCRtpSender的功能。
(五)RTCRtpSender实例的方法(5种)
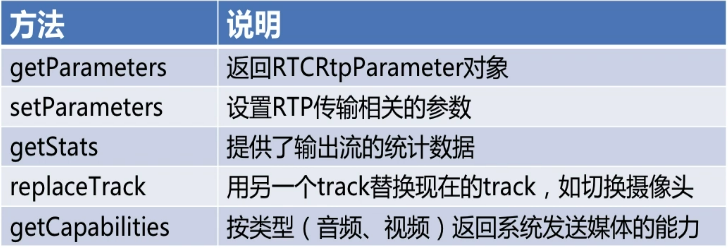
getParameters(同receiver):返回一个RTCRtpParameters对象,其中包含有关如何解码RTP数据的信息。
方法返回一个RTCRtpReceiveParameters对象,该对象描述了在发送轨上面的媒体关于编码和传输的配置。
setParameters:由于更改发送方轨的配置,该轨是RTCRtpSender负责的MediaStreamTrack。比如最大码率、帧率都是可以改变的
换句话说,setParameters()更新RTP传输的配置以及WebRTC连接上特定传出媒体轨的编码配置。
getStats(同上):异步请求一个RTCStatsReport对象,该对象提供有关拥有发送方的RTCPeerConnection上传出流量的统计信息,并返回一个Promise,一旦结果可用,将调用该Promise的异步处理程序。
replaceTrack:RTCRtpSender方法replaceTrack将当前用作发送方源的媒体流轨替换为新的MediaStreamTrack。新媒体流轨必须是相同的媒体类型(音频、视频等),切换轨不需要协商。
replaceTrack()的用例之一是在手机的后向和前向摄像头之间切换的常见需求。使用replaceTrack(),可以为每个摄影机设置一个轨迹对象,并根据需要在两者之间切换。
getCapabilities(同上):返回一个RTCRtpCapabilities对象,描述当前设备上RTCRtpSender支持的编解码器和功能。类似地,您可以通过调用静态函数RTCRtpReceiver.getCapabilities()来获取RTCRtpSender的功能。
二:RTP Media结构体
(一)RTP Media结构体
下图列举了receiver与sender用到的所有的结构,以RTCRtpSendParameters最为关键,继承自RTCRtpParameters
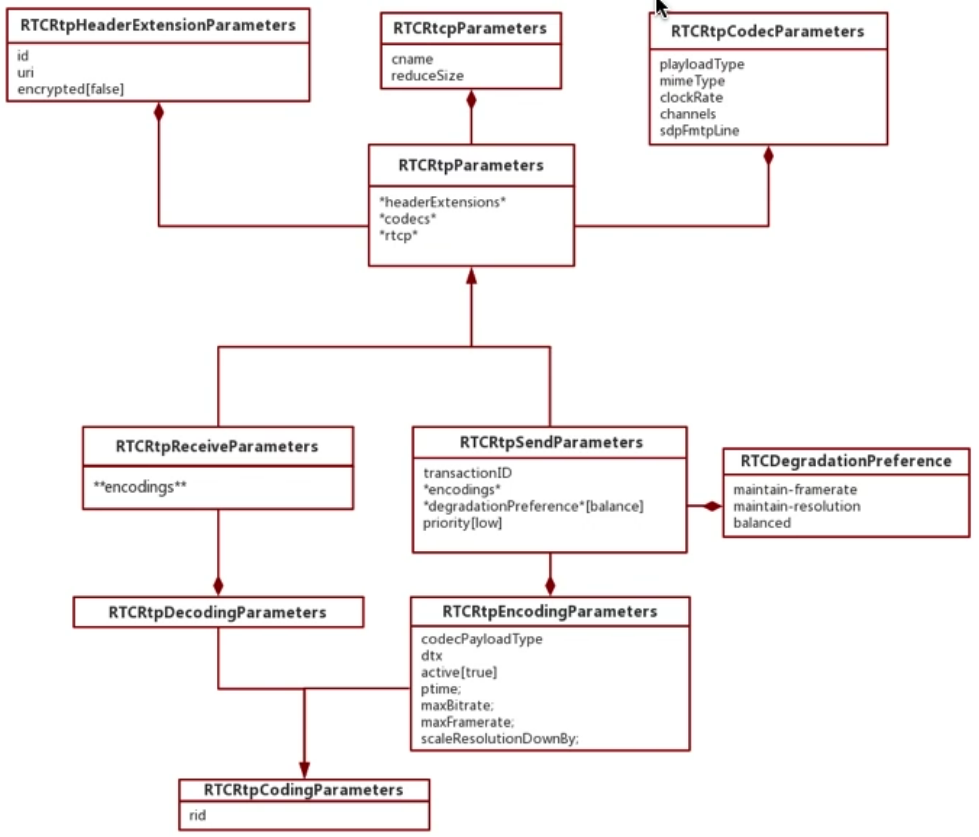
在RTCRtpParameters类中,包含3个成员:
RTCRtpHeaderExtensionParameters:扩展头,包括id,uri,encrypted是否加密,默认false不加密
RTCRtcpParameters:对于没一个Rtp都有一个RTCP与之对应,包括cname(可识别),reduceSize带宽不够时,减少RTCP数量,从而降低带宽
RTCRtpCodecParameters:与编解码相关的参数包括payloadType,mimeType,clockRate,channels,sdpFmtpLine...
除了上面继承的字段之外,RTCRtpSendParameters还包括:
transactionID:事物ID,是唯一标识。使用getParameters会获取到,使用setParameters可以指定要设置的事物的transactionID
encodings:指向RTCRtpEncodingParamters对象,指向一堆编解码器
degradationPreference:指向RTCDegradationPreference对象
priority:指定优先级
RTCRtpEncodingParamters:编解码相关结构体
RTCDegradationPreference:降低码流方法,保持帧率、分辨率或者平衡两者
RTCRtpReceiveParameters相对简单,只进行接收,将数据进行上报给发送端,发送端进行整体的控制,所以发送端的参数会更多些!!
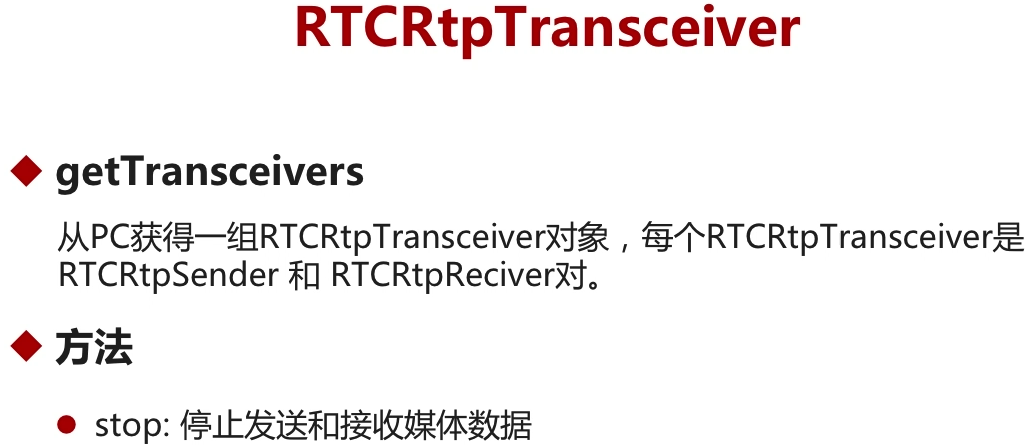
(二)RTCRtpTransceiver
是sender、receiver对,可以同时处理sender与receiver,是对两者的封装
三:实现传输速率的控制
基于:WebRTC学习(八)1V1音视频实时互动直播系统(2)
(一)代码实现


<html>
    <head>
        <title>    WebRTC PeerConnection </title>
        <link href="./css/main.css" rel="stylesheet" />
        <script type="text/javascript" src="https://cdnjs.cloudflare.com/ajax/libs/socket.io/2.0.3/socket.io.js"></script>
    </head>
    <body>
        <div>
            <button id=connserver>Connect Signal Server</button>
            <button id="leave" disabled>Leave</button>
        </div>
        <div id="preview">
            <div>
                <h2>Local:</h2>
                <video autoplay playsinline id="localvideo"></video>
            </div>
            <div>
                <h2>Remote:</h2>
                <video autoplay playsinline id="remotevideo"></video>
            </div>
        </div>

    </body>
    <script type="text/javascript" src="https://webrtc.github.io/adapter/adapter-latest.js"></script>
    <script type="text/javascript" src="./js/main2.js"></script>
</html>
'use strict'

var localVideo = document.querySelector("video#localvideo");
var remoteVideo = document.querySelector("video#remotevideo");

var btnConn = document.querySelector("button#connserver");
var btnLeave = document.querySelector("button#leave");

var SltBW = document.querySelector("select#bandwidth");

var localStream = null;                    //保存本地流为全局变量
var socket = null;

var roomid = "111111";
var state = "init";                        //客户端状态机

var pc = null;                            //定义全局peerconnection变量

function sendMessage(roomid,data){
    console.log("send SDP message",roomid,data);
    if(socket){
        socket.emit("message",roomid,data);
    }
}

function getOffer(desc){
    pc.setLocalDescription(desc);
    sendMessage(roomid,desc);    //发送SDP信息到对端
}

//这里我们本机是远端,收到了对方的offer,一会需要把自己本端的数据回去!!!!!
function getAnswer(desc){                //在offer获取后,设置了远端描述
    pc.setLocalDescription(desc);        //这里只需要设置本端了
    sendMessage(roomid,desc);

    //本端已经收到offer,开始回复answer,说明本端协商完成
    SltBW.disabled = false;
}

//媒体协商方法,发起方调用,创建offer
function call(){
    if(state === "joined_conn"){
        if(pc){
            var options = {
                offerToReceiveAudio:1,
                offerToReceiveVideo:1
            };

            pc.createOffer(options)
                .then(getOffer)
                .catch(handleError);
        }
    }
}

//创建peerconnection,监听一些事件:candidate,当收到candidate事件之后(TURN服务返回),之后转发给另外一端(SIGNAL 服务器实现)
//将本端的媒体流加入peerconnection中去
function createPeerConnection(){
    console.log("Create RTCPeerConnection!");
    if(!pc){
        //设置ICEservers
        var pcConfig = {
            "iceServers" : [{
                'urls':"turn:82.156.184.3:3478",
                'credential':"ssyfj",
                'username':"ssyfj"
            }]
        }
        pc = new RTCPeerConnection(pcConfig);

        pc.onicecandidate = (e)=>{        //处理turn服务返回的candidate信息,媒体协商之后SDP规范中属性获取
            if(e.candidate){
                //发送candidate消息给对端
                console.log("find a new candidate",e.candidate);
                sendMessage(roomid,{
                    type:"candidate",
                    label:e.candidate.sdpMLineIndex,
                    id:e.candidate.sdpMid,
                    candidate:e.candidate.candidate
                });
            }
        };

        pc.ontrack = (e)=>{                //获取到远端的轨数据,设置到页面显示
            remoteVideo.srcObject = e.streams[0];
        }
    }

    if(localStream){                    //将本端的流加入到peerconnection中去
        localStream.getTracks().forEach((track)=>{
            pc.addTrack(track,localStream);
        });
    }
}

//销毁当前peerconnection的流信息
function closeLocalMedia(){
    if(localStream && localStream.getTracks()){
        localStream.getTracks().forEach((track)=>{
            track.stop();
        })
    }
    localStream = null;
}

//关闭peerconnection
function closePeerConnection(){
    console.log("close RTCPeerConnection");
    if(pc){
        pc.close();
        pc = null;
    }
}

function conn(){
    socket = io.connect();                //与信令服务器建立连接,io对象是在前端引入的socket.io文件创立的全局对象

    //开始注册处理服务端的信令消息
    socket.on("joined",(roomid,id)=>{
        console.log("receive joined message:",roomid,id);
        //修改状态
        state = "joined";
        createPeerConnection();            //加入房间后,创建peerconnection,加入流,等到有新的peerconnection加入,就要进行媒体协商

        btnConn.disabled = true;
        btnLeave.disabled = false;

        console.log("receive joined message:state=",state);
    });

    socket.on("otherjoin",(roomid,id)=>{
        console.log("receive otherjoin message:",roomid,id);
        //修改状态,注意:对于一个特殊状态joined_unbind状态需要创建新的peerconnection
        if(state === "joined_unbind"){
            createPeerConnection();
        }

        state = "joined_conn";            //原本joined,现在变为conn
        //媒体协商
        call();

        console.log("receive otherjoin message:state=",state);
    });

    socket.on("full",(roomid,id)=>{
        console.log("receive full message:",roomid,id);
        state = "leaved";
        console.log("receive full message:state=",state);
        socket.disconnect();            //断开连接,虽然没有加入房间,但是连接还是存在的,所以需要进行关闭
        alert("the room is full!");

        btnLeave.disabled = true;
        btnConn.disabled = false;
    });

    socket.on("leaved",(roomid,id)=>{    //------资源的释放在发送leave消息给服务器的时候就释放了,符合离开流程图
        console.log("receive leaved message:",roomid,id);
        state = "leaved";                //初始状态
        console.log("receive leaved message:state=",state);

        //这里断开连接
        socket.disconnect();
        btnLeave.disabled = true;
        btnConn.disabled = false;
    });

    socket.on("bye",(roomid,id)=>{
        console.log("receive bye message:",roomid,id);
        state = "joined_unbind";
        console.log("receive bye message:state=",state);

        //开始处理peerconneciton
        closePeerConnection();
    });

    socket.on("message",(roomid,data)=>{
        console.log("receive client message:",roomid,data);
        //处理媒体协商数据,进行转发给信令服务器,处理不同类型的数据,如果是流媒体数据,直接p2p转发
        if(data){    //只有下面3种数据,对于媒体流数据,走的是p2p路线,不经过信令服务器中转
            if(data.type === "offer"){                //这里表示我们本机是远端,收到了对方的offer,一会需要把自己本端的数据回去!!!!!
                pc.setRemoteDescription(new RTCSessionDescription(data));    //需要把传输过来的文本转对象
                pc.createAnswer()
                    .then(getAnswer)
                    .catch(handleError);

            }else if(data.type === "answer"){
                pc.setRemoteDescription(new RTCSessionDescription(data));
                //收到对端发送过来的SDP信息,说明协商完成
                SltBW.disabled = false;
            }else if(data.type === "candidate"){    //在双方设置完成setLocalDescription之后,双方开始交换candidate,每当收集一个candidate之后都会触发pc的onicecandidate事件
                var candidate = new RTCIceCandidate({
                    sdpMLineIndex:data.label,         //媒体行的行号 m=video ...
                    candidate:data.candidate
                });                                    //生成candidate,是从TURN/STUN服务端获取的,下面开始添加到本地pc中去,用于发送到远端
                //将candidate添加到pc
                pc.addIceCandidate(candidate);        //发送到对端,触发对端onicecandidate事件

            }else{
                console.error("the message is invalid!",data);
            }
        }
    });

    //开始发送加入消息
    socket.emit("join",roomid);
    return;
}

function getMediaStream(stream){
    localStream = stream;                //保存到全局变量,用于传输到对端
    localVideo.srcObject = localStream;    //显示在页面中,本端

    //-------与signal server进行连接,接受信令消息!!------
    conn();
}

function handleError(err){
    console.err(err.name+":"+err.message);
}

//初始化操作,获取本地音视频数据
function start(){
    if(!navigator.mediaDevices || !navigator.mediaDevices.getUserMedia){
        console.error("the getUserMedia is not support!");
        return;
    }else{
        var constraints = {
            video : true,
            audio : false
        };

        navigator.mediaDevices.getUserMedia(constraints)
                                .then(getMediaStream)
                                .catch(handleError);
    }

}

function connSignalServer(){
    //开启本地视频
    start();

    return true;
}

function leave(){
    if(socket){
        socket.emit("leave",roomid);
    }

    //释放资源
    closePeerConnection();
    closeLocalMedia();

    btnConn.disabled = false;
    btnLeave.disabled = true;
}

function changeBW(){
    SltBW.disabled = true;
     var bw = SltBW.options[SltBW.selectedIndex].value;
     if(bw==="unlimited"){
         return;
     }

     //获取所有的发送器
     var senders = pc.getSenders();
     var vdsender = null;
     //开始对视频流进行限流
     senders.forEach((sender)=>{
         if(sender && sender.track &&sender.track.kind === "video"){
             vdsender = sender;    //获取到视频流的sender
         }
     });

     //获取参数
     var parameters = vdsender.getParameters();
     if(!parameters.encodings){    //从编解码器中设置最大码率
         return;
     }

     parameters.encodings[0].maxBitrate = bw*1000;

     vdsender.setParameters(parameters)
                 .then(()=>{
                    SltBW.disabled = false;
                     console.log("Success to set parameters");
                 })
                 .catch(handleError);
}

//设置触发事件
btnConn.onclick = connSignalServer;    //获取本地音视频数据,展示在页面,socket连接建立与信令服务器,注册信令消息处理函数,发送join信息给信令服务器
btnLeave.onclick = leave;
SltBW.onchange = changeBW;
主要事件:
function changeBW(){
    SltBW.disabled = true;
     var bw = SltBW.options[SltBW.selectedIndex].value;
     if(bw==="unlimited"){
         return;
     }

     //获取所有的发送器
     var senders = pc.getSenders();
     var vdsender = null;
     //开始对视频流进行限流
     senders.forEach((sender)=>{
         if(sender && sender.track &&sender.track.kind === "video"){
             vdsender = sender;    //获取到视频流的sender
         }
     });

     //获取参数
     var parameters = vdsender.getParameters();
     if(!parameters.encodings){    //从编解码器中设置最大码率
         return;
     }

     parameters.encodings[0].maxBitrate = bw*1000;

     vdsender.setParameters(parameters)
                 .then(()=>{
                    SltBW.disabled = false;
                     console.log("Success to set parameters");
                 })
                 .catch(handleError);
}
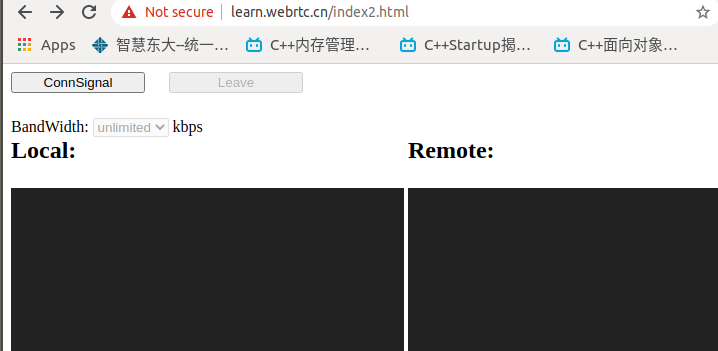
(二)结果测试
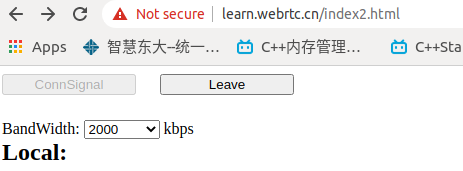
1.发送端码流控制
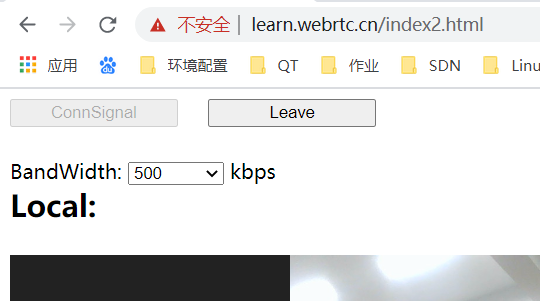
2.接受端码率控制
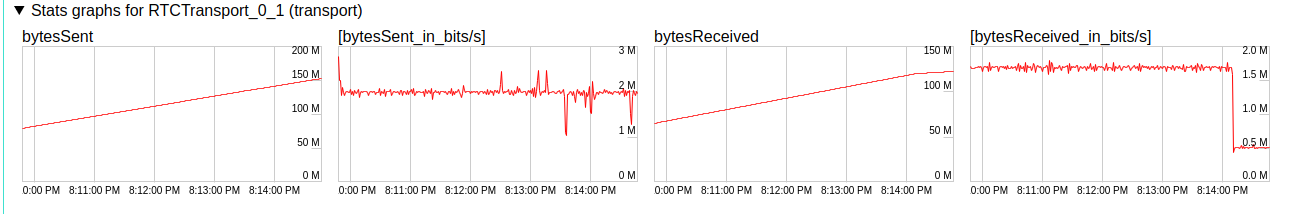
3.通过谷歌调试 chrome://webrtc-internals/
可以看到第二副图,是发送方的码率控制在2M左右,接受方的码率第四副图中被控制到0.5M
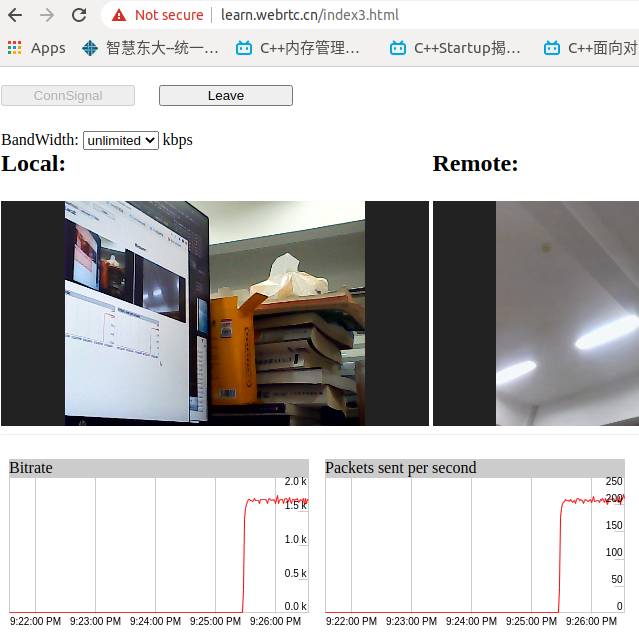
四:实现统计信息(流量/s,包数/s)
(一)代码实现
/*
 *  Copyright (c) 2015 The WebRTC project authors. All Rights Reserved.
 *
 *  Use of this source code is governed by a BSD-style license
 *  that can be found in the LICENSE file in the root of the source
 *  tree.
 */

button {
  margin: 10px 20px 25px 0;
  vertical-align: top;
   134px;
}

table {
  margin: 200px (50% - 100) 0 0;
}

textarea {
  color: #444;
  font-size: 0.9em;
  font-weight: 300;
  height: 20.0em;
  padding: 5px;
   calc(100% - 10px);
}

div#getUserMedia {
  padding: 0 0 8px 0;
}

div.input {
  display: inline-block;
  margin: 0 4px 0 0;
  vertical-align: top;
   310px;
}

div.input > div {
  margin: 0 0 20px 0;
  vertical-align: top;
}

div.output {
  background-color: #eee;
  display: inline-block;
  font-family: 'Inconsolata', 'Courier New', monospace;
  font-size: 0.9em;
  padding: 10px 10px 10px 25px;
  position: relative;
  top: 10px;
  white-space: pre;
   270px;
}

div.label {
    display: inline-block;
    font-weight: 400;
     120px;
}

div.graph-container {
  background-color: #ccc;
  float: left;
  margin: 0.5em;
   calc(50%-1em);
}

div#preview {
  border-bottom: 1px solid #eee;
  margin: 0 0 1em 0;
  padding: 0 0 0.5em 0;
}

div#preview > div {
  display: inline-block;
  vertical-align: top;
   calc(50% - 12px);
}

section#statistics div {
  display: inline-block;
  font-family: 'Inconsolata', 'Courier New', monospace;
  vertical-align: top;
   308px;
}

section#statistics div#senderStats {
  margin: 0 20px 0 0;
}

section#constraints > div {
  margin: 0 0 20px 0;
}

h2 {
  margin: 0 0 1em 0;
}


section#constraints label {
  display: inline-block;
   156px;
}

section {
  margin: 0 0 20px 0;
  padding: 0 0 15px 0;
}

video {
  background: #222;
  margin: 0 0 0 0;
  -- 100%;
   var(--width);
  height: 225px;
}

@media screen and (max- 720px) {
  button {
    font-weight: 500;
    height: 56px;
    line-height: 1.3em;
     90px;
  }

  div#getUserMedia {
    padding: 0 0 40px 0;
  }

  section#statistics div {
     calc(50% - 14px);
  }

}
/*
 *  Copyright (c) 2015 The WebRTC project authors. All Rights Reserved.
 *
 *  Use of this source code is governed by a BSD-style license
 *  that can be found in the LICENSE file in the root of the source
 *  tree.
 */
// taken from chrome://webrtc-internals with jshint adaptions

'use strict';
/* exported TimelineDataSeries, TimelineGraphView */

// The maximum number of data points bufferred for each stats. Old data points
// will be shifted out when the buffer is full.
const MAX_STATS_DATA_POINT_BUFFER_SIZE = 1000;

const TimelineDataSeries = (function() {
  /**
   * @constructor
   */
  function TimelineDataSeries() {
    // List of DataPoints in chronological order.
    this.dataPoints_ = [];

    // Default color.  Should always be overridden prior to display.
    this.color_ = 'red';
    // Whether or not the data series should be drawn.
    this.isVisible_ = true;

    this.cacheStartTime_ = null;
    this.cacheStepSize_ = 0;
    this.cacheValues_ = [];
  }

  TimelineDataSeries.prototype = {
    /**
     * @override
     */
    toJSON: function() {
      if (this.dataPoints_.length < 1) {
        return {};
      }

      let values = [];
      for (let i = 0; i < this.dataPoints_.length; ++i) {
        values.push(this.dataPoints_[i].value);
      }
      return {
        startTime: this.dataPoints_[0].time,
        endTime: this.dataPoints_[this.dataPoints_.length - 1].time,
        values: JSON.stringify(values),
      };
    },

    /**
     * Adds a DataPoint to |this| with the specified time and value.
     * DataPoints are assumed to be received in chronological order.
     */
    addPoint: function(timeTicks, value) {
      let time = new Date(timeTicks);
      this.dataPoints_.push(new DataPoint(time, value));

      if (this.dataPoints_.length > MAX_STATS_DATA_POINT_BUFFER_SIZE) {
        this.dataPoints_.shift();
      }
    },

    isVisible: function() {
      return this.isVisible_;
    },

    show: function(isVisible) {
      this.isVisible_ = isVisible;
    },

    getColor: function() {
      return this.color_;
    },

    setColor: function(color) {
      this.color_ = color;
    },

    getCount: function() {
      return this.dataPoints_.length;
    },
    /**
     * Returns a list containing the values of the data series at |count|
     * points, starting at |startTime|, and |stepSize| milliseconds apart.
     * Caches values, so showing/hiding individual data series is fast.
     */
    getValues: function(startTime, stepSize, count) {
      // Use cached values, if we can.
      if (this.cacheStartTime_ === startTime &&
        this.cacheStepSize_ === stepSize &&
        this.cacheValues_.length === count) {
        return this.cacheValues_;
      }

      // Do all the work.
      this.cacheValues_ = this.getValuesInternal_(startTime, stepSize, count);
      this.cacheStartTime_ = startTime;
      this.cacheStepSize_ = stepSize;

      return this.cacheValues_;
    },

    /**
     * Returns the cached |values| in the specified time period.
     */
    getValuesInternal_: function(startTime, stepSize, count) {
      let values = [];
      let nextPoint = 0;
      let currentValue = 0;
      let time = startTime;
      for (let i = 0; i < count; ++i) {
        while (nextPoint < this.dataPoints_.length &&
        this.dataPoints_[nextPoint].time < time) {
          currentValue = this.dataPoints_[nextPoint].value;
          ++nextPoint;
        }
        values[i] = currentValue;
        time += stepSize;
      }
      return values;
    }
  };

  /**
   * A single point in a data series.  Each point has a time, in the form of
   * milliseconds since the Unix epoch, and a numeric value.
   * @constructor
   */
  function DataPoint(time, value) {
    this.time = time;
    this.value = value;
  }

  return TimelineDataSeries;
})();

const TimelineGraphView = (function() {
  // Maximum number of labels placed vertically along the sides of the graph.
  let MAX_VERTICAL_LABELS = 6;

  // Vertical spacing between labels and between the graph and labels.
  let LABEL_VERTICAL_SPACING = 4;
  // Horizontal spacing between vertically placed labels and the edges of the
  // graph.
  let LABEL_HORIZONTAL_SPACING = 3;
  // Horizintal spacing between two horitonally placed labels along the bottom
  // of the graph.
  // var LABEL_LABEL_HORIZONTAL_SPACING = 25;

  // Length of ticks, in pixels, next to y-axis labels.  The x-axis only has
  // one set of labels, so it can use lines instead.
  let Y_AXIS_TICK_LENGTH = 10;

  let GRID_COLOR = '#CCC';
  let TEXT_COLOR = '#000';
  let BACKGROUND_COLOR = '#FFF';

  let MAX_DECIMAL_PRECISION = 2;

  /**
   * @constructor
   */
  function TimelineGraphView(divId, canvasId) {
    this.scrollbar_ = {position_: 0, range_: 0};

    this.graphDiv_ = document.getElementById(divId);
    this.canvas_ = document.getElementById(canvasId);

    // Set the range and scale of the graph.  Times are in milliseconds since
    // the Unix epoch.

    // All measurements we have must be after this time.
    this.startTime_ = 0;
    // The current rightmost position of the graph is always at most this.
    this.endTime_ = 1;

    this.graph_ = null;

    // Horizontal scale factor, in terms of milliseconds per pixel.
    this.scale_ = 1000;

    // Initialize the scrollbar.
    this.updateScrollbarRange_(true);
  }

  TimelineGraphView.prototype = {
    setScale: function(scale) {
      this.scale_ = scale;
    },

    // Returns the total length of the graph, in pixels.
    getLength_: function() {
      let timeRange = this.endTime_ - this.startTime_;
      // Math.floor is used to ignore the last partial area, of length less
      // than this.scale_.
      return Math.floor(timeRange / this.scale_);
    },

    /**
     * Returns true if the graph is scrolled all the way to the right.
     */
    graphScrolledToRightEdge_: function() {
      return this.scrollbar_.position_ === this.scrollbar_.range_;
    },

    /**
     * Update the range of the scrollbar.  If |resetPosition| is true, also
     * sets the slider to point at the rightmost position and triggers a
     * repaint.
     */
    updateScrollbarRange_: function(resetPosition) {
      let scrollbarRange = this.getLength_() - this.canvas_.width;
      if (scrollbarRange < 0) {
        scrollbarRange = 0;
      }

      // If we've decreased the range to less than the current scroll position,
      // we need to move the scroll position.
      if (this.scrollbar_.position_ > scrollbarRange) {
        resetPosition = true;
      }

      this.scrollbar_.range_ = scrollbarRange;
      if (resetPosition) {
        this.scrollbar_.position_ = scrollbarRange;
        this.repaint();
      }
    },

    /**
     * Sets the date range displayed on the graph, switches to the default
     * scale factor, and moves the scrollbar all the way to the right.
     */
    setDateRange: function(startDate, endDate) {
      this.startTime_ = startDate.getTime();
      this.endTime_ = endDate.getTime();

      // Safety check.
      if (this.endTime_ <= this.startTime_) {
        this.startTime_ = this.endTime_ - 1;
      }

      this.updateScrollbarRange_(true);
    },

    /**
     * Updates the end time at the right of the graph to be the current time.
     * Specifically, updates the scrollbar's range, and if the scrollbar is
     * all the way to the right, keeps it all the way to the right.  Otherwise,
     * leaves the view as-is and doesn't redraw anything.
     */
    updateEndDate: function(optDate) {
      this.endTime_ = optDate || (new Date()).getTime();
      this.updateScrollbarRange_(this.graphScrolledToRightEdge_());
    },

    getStartDate: function() {
      return new Date(this.startTime_);
    },

    /**
     * Replaces the current TimelineDataSeries with |dataSeries|.
     */
    setDataSeries: function(dataSeries) {
      // Simply recreates the Graph.
      this.graph_ = new Graph();
      for (let i = 0; i < dataSeries.length; ++i) {
        this.graph_.addDataSeries(dataSeries[i]);
      }
      this.repaint();
    },

    /**
     * Adds |dataSeries| to the current graph.
     */
    addDataSeries: function(dataSeries) {
      if (!this.graph_) {
        this.graph_ = new Graph();
      }
      this.graph_.addDataSeries(dataSeries);
      this.repaint();
    },

    /**
     * Draws the graph on |canvas_|.
     */
    repaint: function() {
      this.repaintTimerRunning_ = false;

      let width = this.canvas_.width;
      let height = this.canvas_.height;
      let context = this.canvas_.getContext('2d');

      // Clear the canvas.
      context.fillStyle = BACKGROUND_COLOR;
      context.fillRect(0, 0, width, height);

      // Try to get font height in pixels.  Needed for layout.
      let fontHeightString = context.font.match(/([0-9]+)px/)[1];
      let fontHeight = parseInt(fontHeightString);

      // Safety check, to avoid drawing anything too ugly.
      if (fontHeightString.length === 0 || fontHeight <= 0 ||
        fontHeight * 4 > height || width < 50) {
        return;
      }

      // Save current transformation matrix so we can restore it later.
      context.save();

      // The center of an HTML canvas pixel is technically at (0.5, 0.5).  This
      // makes near straight lines look bad, due to anti-aliasing.  This
      // translation reduces the problem a little.
      context.translate(0.5, 0.5);

      // Figure out what time values to display.
      let position = this.scrollbar_.position_;
      // If the entire time range is being displayed, align the right edge of
      // the graph to the end of the time range.
      if (this.scrollbar_.range_ === 0) {
        position = this.getLength_() - this.canvas_.width;
      }
      let visibleStartTime = this.startTime_ + position * this.scale_;

      // Make space at the bottom of the graph for the time labels, and then
      // draw the labels.
      let textHeight = height;
      height -= fontHeight + LABEL_VERTICAL_SPACING;
      this.drawTimeLabels(context, width, height, textHeight, visibleStartTime);

      // Draw outline of the main graph area.
      context.strokeStyle = GRID_COLOR;
      context.strokeRect(0, 0, width - 1, height - 1);

      if (this.graph_) {
        // Layout graph and have them draw their tick marks.
        this.graph_.layout(
          width, height, fontHeight, visibleStartTime, this.scale_);
        this.graph_.drawTicks(context);

        // Draw the lines of all graphs, and then draw their labels.
        this.graph_.drawLines(context);
        this.graph_.drawLabels(context);
      }

      // Restore original transformation matrix.
      context.restore();
    },

    /**
     * Draw time labels below the graph.  Takes in start time as an argument
     * since it may not be |startTime_|, when we're displaying the entire
     * time range.
     */
    drawTimeLabels: function(context, width, height, textHeight, startTime) {
      // Draw the labels 1 minute apart.
      let timeStep = 1000 * 60;

      // Find the time for the first label.  This time is a perfect multiple of
      // timeStep because of how UTC times work.
      let time = Math.ceil(startTime / timeStep) * timeStep;

      context.textBaseline = 'bottom';
      context.textAlign = 'center';
      context.fillStyle = TEXT_COLOR;
      context.strokeStyle = GRID_COLOR;

      // Draw labels and vertical grid lines.
      while (true) {
        let x = Math.round((time - startTime) / this.scale_);
        if (x >= width) {
          break;
        }
        let text = (new Date(time)).toLocaleTimeString();
        context.fillText(text, x, textHeight);
        context.beginPath();
        context.lineTo(x, 0);
        context.lineTo(x, height);
        context.stroke();
        time += timeStep;
      }
    },

    getDataSeriesCount: function() {
      if (this.graph_) {
        return this.graph_.dataSeries_.length;
      }
      return 0;
    },

    hasDataSeries: function(dataSeries) {
      if (this.graph_) {
        return this.graph_.hasDataSeries(dataSeries);
      }
      return false;
    },

  };

  /**
   * A Graph is responsible for drawing all the TimelineDataSeries that have
   * the same data type.  Graphs are responsible for scaling the values, laying
   * out labels, and drawing both labels and lines for its data series.
   */
  const Graph = (function() {
    /**
     * @constructor
     */
    function Graph() {
      this.dataSeries_ = [];

      // Cached properties of the graph, set in layout.
      this.width_ = 0;
      this.height_ = 0;
      this.fontHeight_ = 0;
      this.startTime_ = 0;
      this.scale_ = 0;

      // The lowest/highest values adjusted by the vertical label step size
      // in the displayed range of the graph. Used for scaling and setting
      // labels.  Set in layoutLabels.
      this.min_ = 0;
      this.max_ = 0;

      // Cached text of equally spaced labels.  Set in layoutLabels.
      this.labels_ = [];
    }

    /**
     * A Label is the label at a particular position along the y-axis.
     * @constructor
     */
    /*
    function Label(height, text) {
      this.height = height;
      this.text = text;
    }
    */

    Graph.prototype = {
      addDataSeries: function(dataSeries) {
        this.dataSeries_.push(dataSeries);
      },

      hasDataSeries: function(dataSeries) {
        for (let i = 0; i < this.dataSeries_.length; ++i) {
          if (this.dataSeries_[i] === dataSeries) {
            return true;
          }
        }
        return false;
      },

      /**
       * Returns a list of all the values that should be displayed for a given
       * data series, using the current graph layout.
       */
      getValues: function(dataSeries) {
        if (!dataSeries.isVisible()) {
          return null;
        }
        return dataSeries.getValues(this.startTime_, this.scale_, this.width_);
      },

      /**
       * Updates the graph's layout.  In particular, both the max value and
       * label positions are updated.  Must be called before calling any of the
       * drawing functions.
       */
      layout: function(width, height, fontHeight, startTime, scale) {
        this.width_ = width;
        this.height_ = height;
        this.fontHeight_ = fontHeight;
        this.startTime_ = startTime;
        this.scale_ = scale;

        // Find largest value.
        let max = 0;
        let min = 0;
        for (let i = 0; i < this.dataSeries_.length; ++i) {
          let values = this.getValues(this.dataSeries_[i]);
          if (!values) {
            continue;
          }
          for (let j = 0; j < values.length; ++j) {
            if (values[j] > max) {
              max = values[j];
            } else if (values[j] < min) {
              min = values[j];
            }
          }
        }

        this.layoutLabels_(min, max);
      },

      /**
       * Lays out labels and sets |max_|/|min_|, taking the time units into
       * consideration.  |maxValue| is the actual maximum value, and
       * |max_| will be set to the value of the largest label, which
       * will be at least |maxValue|. Similar for |min_|.
       */
      layoutLabels_: function(minValue, maxValue) {
        if (maxValue - minValue < 1024) {
          this.layoutLabelsBasic_(minValue, maxValue, MAX_DECIMAL_PRECISION);
          return;
        }

        // Find appropriate units to use.
        let units = ['', 'k', 'M', 'G', 'T', 'P'];
        // Units to use for labels.  0 is '1', 1 is K, etc.
        // We start with 1, and work our way up.
        let unit = 1;
        minValue /= 1024;
        maxValue /= 1024;
        while (units[unit + 1] && maxValue - minValue >= 1024) {
          minValue /= 1024;
          maxValue /= 1024;
          ++unit;
        }

        // Calculate labels.
        this.layoutLabelsBasic_(minValue, maxValue, MAX_DECIMAL_PRECISION);

        // Append units to labels.
        for (let i = 0; i < this.labels_.length; ++i) {
          this.labels_[i] += ' ' + units[unit];
        }

        // Convert |min_|/|max_| back to unit '1'.
        this.min_ *= Math.pow(1024, unit);
        this.max_ *= Math.pow(1024, unit);
      },

      /**
       * Same as layoutLabels_, but ignores units.  |maxDecimalDigits| is the
       * maximum number of decimal digits allowed.  The minimum allowed
       * difference between two adjacent labels is 10^-|maxDecimalDigits|.
       */
      layoutLabelsBasic_: function(minValue, maxValue, maxDecimalDigits) {
        this.labels_ = [];
        let range = maxValue - minValue;
        // No labels if the range is 0.
        if (range === 0) {
          this.min_ = this.max_ = maxValue;
          return;
        }

        // The maximum number of equally spaced labels allowed.  |fontHeight_|
        // is doubled because the top two labels are both drawn in the same
        // gap.
        let minLabelSpacing = 2 * this.fontHeight_ + LABEL_VERTICAL_SPACING;

        // The + 1 is for the top label.
        let maxLabels = 1 + this.height_ / minLabelSpacing;
        if (maxLabels < 2) {
          maxLabels = 2;
        } else if (maxLabels > MAX_VERTICAL_LABELS) {
          maxLabels = MAX_VERTICAL_LABELS;
        }

        // Initial try for step size between conecutive labels.
        let stepSize = Math.pow(10, -maxDecimalDigits);
        // Number of digits to the right of the decimal of |stepSize|.
        // Used for formating label strings.
        let stepSizeDecimalDigits = maxDecimalDigits;

        // Pick a reasonable step size.
        while (true) {
          // If we use a step size of |stepSize| between labels, we'll need:
          //
          // Math.ceil(range / stepSize) + 1
          //
          // labels.  The + 1 is because we need labels at both at 0 and at
          // the top of the graph.

          // Check if we can use steps of size |stepSize|.
          if (Math.ceil(range / stepSize) + 1 <= maxLabels) {
            break;
          }
          // Check |stepSize| * 2.
          if (Math.ceil(range / (stepSize * 2)) + 1 <= maxLabels) {
            stepSize *= 2;
            break;
          }
          // Check |stepSize| * 5.
          if (Math.ceil(range / (stepSize * 5)) + 1 <= maxLabels) {
            stepSize *= 5;
            break;
          }
          stepSize *= 10;
          if (stepSizeDecimalDigits > 0) {
            --stepSizeDecimalDigits;
          }
        }

        // Set the min/max so it's an exact multiple of the chosen step size.
        this.max_ = Math.ceil(maxValue / stepSize) * stepSize;
        this.min_ = Math.floor(minValue / stepSize) * stepSize;

        // Create labels.
        for (let label = this.max_; label >= this.min_; label -= stepSize) {
          this.labels_.push(label.toFixed(stepSizeDecimalDigits));
        }
      },

      /**
       * Draws tick marks for each of the labels in |labels_|.
       */
      drawTicks: function(context) {
        let x1;
        let x2;
        x1 = this.width_ - 1;
        x2 = this.width_ - 1 - Y_AXIS_TICK_LENGTH;

        context.fillStyle = GRID_COLOR;
        context.beginPath();
        for (let i = 1; i < this.labels_.length - 1; ++i) {
          // The rounding is needed to avoid ugly 2-pixel wide anti-aliased
          // lines.
          let y = Math.round(this.height_ * i / (this.labels_.length - 1));
          context.moveTo(x1, y);
          context.lineTo(x2, y);
        }
        context.stroke();
      },

      /**
       * Draws a graph line for each of the data series.
       */
      drawLines: function(context) {
        // Factor by which to scale all values to convert them to a number from
        // 0 to height - 1.
        let scale = 0;
        let bottom = this.height_ - 1;
        if (this.max_) {
          scale = bottom / (this.max_ - this.min_);
        }

        // Draw in reverse order, so earlier data series are drawn on top of
        // subsequent ones.
        for (let i = this.dataSeries_.length - 1; i >= 0; --i) {
          let values = this.getValues(this.dataSeries_[i]);
          if (!values) {
            continue;
          }
          context.strokeStyle = this.dataSeries_[i].getColor();
          context.beginPath();
          for (let x = 0; x < values.length; ++x) {
            // The rounding is needed to avoid ugly 2-pixel wide anti-aliased
            // horizontal lines.
            context.lineTo(
              x, bottom - Math.round((values[x] - this.min_) * scale));
          }
          context.stroke();
        }
      },

      /**
       * Draw labels in |labels_|.
       */
      drawLabels: function(context) {
        if (this.labels_.length === 0) {
          return;
        }
        let x = this.width_ - LABEL_HORIZONTAL_SPACING;

        // Set up the context.
        context.fillStyle = TEXT_COLOR;
        context.textAlign = 'right';

        // Draw top label, which is the only one that appears below its tick
        // mark.
        context.textBaseline = 'top';
        context.fillText(this.labels_[0], x, 0);

        // Draw all the other labels.
        context.textBaseline = 'bottom';
        let step = (this.height_ - 1) / (this.labels_.length - 1);
        for (let i = 1; i < this.labels_.length; ++i) {
          context.fillText(this.labels_[i], x, step * i);
        }
      }
    };

    return Graph;
  })();

  return TimelineGraphView;
})();
<html>
    <head>
        <title>    WebRTC PeerConnection </title>
        <link href="./css/main.css" rel="stylesheet" />
        <script type="text/javascript" src="https://cdnjs.cloudflare.com/ajax/libs/socket.io/2.0.3/socket.io.js"></script>
    </head>
    <body>
        <div>
            <button id=connserver>ConnSignal</button>
            <button id="leave" disabled>Leave</button>
        </div>
        <div>
            <label>BandWidth:</label>
            <select id="bandwidth" disabled>    <!--带宽限制-->
                <option value="unlimited" selected>unlimited</option>
                <option value="125">125</option>
                <option value="250">250</option>
                <option value="500">500</option>
                <option value="1000">1000</option>
                <option value="2000">2000</option>
            </select>
            kbps
        </div>
        <div id="preview">
            <div>
                <h2>Local:</h2>
                <video autoplay playsinline id="localvideo"></video>
            </div>
            <div>
                <h2>Remote:</h2>
                <video autoplay playsinline id="remotevideo"></video>
            </div>
        </div>
        <div class="graph-container" id="bitrateGraph">
            <div>Bitrate</div>
            <canvas id="bitrateCanvas"></canvas>
        </div>
        <div class="graph-container" id="packetGraph">
            <div>Packets sent per second</div>
            <canvas id="packetCanvas"></canvas>
        </div>
    </body>
    <script type="text/javascript" src="https://webrtc.github.io/adapter/adapter-latest.js"></script>
    <script type="text/javascript" src="./js/main3.js"></script>
    <script type="text/javascript" src="./js/third_party/graph.js"></script>
</html>
'use strict'

var localVideo = document.querySelector("video#localvideo");
var remoteVideo = document.querySelector("video#remotevideo");

var btnConn = document.querySelector("button#connserver");
var btnLeave = document.querySelector("button#leave");

var SltBW = document.querySelector("select#bandwidth");

//绘制图像,在获取了本地媒体流之后设置
var bitrateGraph;
var bitrateSeries;

var packetGraph;
var packetSeries;


var localStream = null;                    //保存本地流为全局变量
var socket = null;

var roomid = "111111";
var state = "init";                        //客户端状态机

var pc = null;                            //定义全局peerconnection变量

var lastResult = null;                    //全局变量,获取统计值

function sendMessage(roomid,data){
    console.log("send SDP message",roomid,data);
    if(socket){
        socket.emit("message",roomid,data);
    }
}

function getOffer(desc){
    pc.setLocalDescription(desc);
    sendMessage(roomid,desc);    //发送SDP信息到对端
}

//这里我们本机是远端,收到了对方的offer,一会需要把自己本端的数据回去!!!!!
function getAnswer(desc){                //在offer获取后,设置了远端描述
    pc.setLocalDescription(desc);        //这里只需要设置本端了
    sendMessage(roomid,desc);

    //本端已经收到offer,开始回复answer,说明本端协商完成
    SltBW.disabled = false;
}

//媒体协商方法,发起方调用,创建offer
function call(){
    if(state === "joined_conn"){
        if(pc){
            var options = {
                offerToReceiveAudio:1,
                offerToReceiveVideo:1
            };

            pc.createOffer(options)
                .then(getOffer)
                .catch(handleError);
        }
    }
}

//创建peerconnection,监听一些事件:candidate,当收到candidate事件之后(TURN服务返回),之后转发给另外一端(SIGNAL 服务器实现)
//将本端的媒体流加入peerconnection中去
function createPeerConnection(){
    console.log("Create RTCPeerConnection!");
    if(!pc){
        //设置ICEservers
        var pcConfig = {
            "iceServers" : [{
                'urls':"turn:82.156.184.3:3478",
                'credential':"ssyfj",
                'username':"ssyfj"
            }]
        }
        pc = new RTCPeerConnection(pcConfig);

        pc.onicecandidate = (e)=>{        //处理turn服务返回的candidate信息,媒体协商之后SDP规范中属性获取
            if(e.candidate){
                //发送candidate消息给对端
                console.log("find a new candidate",e.candidate);
                sendMessage(roomid,{
                    type:"candidate",
                    label:e.candidate.sdpMLineIndex,
                    id:e.candidate.sdpMid,
                    candidate:e.candidate.candidate
                });
            }
        };

        pc.ontrack = (e)=>{                //获取到远端的轨数据,设置到页面显示
            remoteVideo.srcObject = e.streams[0];
        }
    }

    if(localStream){                    //将本端的流加入到peerconnection中去
        localStream.getTracks().forEach((track)=>{
            pc.addTrack(track,localStream);
        });
    }
}

//销毁当前peerconnection的流信息
function closeLocalMedia(){
    if(localStream && localStream.getTracks()){
        localStream.getTracks().forEach((track)=>{
            track.stop();
        })
    }
    localStream = null;
}

//关闭peerconnection
function closePeerConnection(){
    console.log("close RTCPeerConnection");
    if(pc){
        pc.close();
        pc = null;
    }
}

function conn(){
    socket = io.connect();                //与信令服务器建立连接,io对象是在前端引入的socket.io文件创立的全局对象

    //开始注册处理服务端的信令消息
    socket.on("joined",(roomid,id)=>{
        console.log("receive joined message:",roomid,id);
        //修改状态
        state = "joined";
        createPeerConnection();            //加入房间后,创建peerconnection,加入流,等到有新的peerconnection加入,就要进行媒体协商

        btnConn.disabled = true;
        btnLeave.disabled = false;

        console.log("receive joined message:state=",state);
    });

    socket.on("otherjoin",(roomid,id)=>{
        console.log("receive otherjoin message:",roomid,id);
        //修改状态,注意:对于一个特殊状态joined_unbind状态需要创建新的peerconnection
        if(state === "joined_unbind"){
            createPeerConnection();
        }

        state = "joined_conn";            //原本joined,现在变为conn
        //媒体协商
        call();

        console.log("receive otherjoin message:state=",state);
    });

    socket.on("full",(roomid,id)=>{
        console.log("receive full message:",roomid,id);
        state = "leaved";
        console.log("receive full message:state=",state);
        socket.disconnect();            //断开连接,虽然没有加入房间,但是连接还是存在的,所以需要进行关闭
        alert("the room is full!");

        btnLeave.disabled = true;
        btnConn.disabled = false;
    });

    socket.on("leaved",(roomid,id)=>{    //------资源的释放在发送leave消息给服务器的时候就释放了,符合离开流程图
        console.log("receive leaved message:",roomid,id);
        state = "leaved";                //初始状态
        console.log("receive leaved message:state=",state);

        //这里断开连接
        socket.disconnect();
        btnLeave.disabled = true;
        btnConn.disabled = false;
    });

    socket.on("bye",(roomid,id)=>{
        console.log("receive bye message:",roomid,id);
        state = "joined_unbind";
        console.log("receive bye message:state=",state);

        //开始处理peerconneciton
        closePeerConnection();
    });

    socket.on("message",(roomid,data)=>{
        console.log("receive client message:",roomid,data);
        //处理媒体协商数据,进行转发给信令服务器,处理不同类型的数据,如果是流媒体数据,直接p2p转发
        if(data){    //只有下面3种数据,对于媒体流数据,走的是p2p路线,不经过信令服务器中转
            if(data.type === "offer"){                //这里表示我们本机是远端,收到了对方的offer,一会需要把自己本端的数据回去!!!!!
                pc.setRemoteDescription(new RTCSessionDescription(data));    //需要把传输过来的文本转对象
                pc.createAnswer()
                    .then(getAnswer)
                    .catch(handleError);

            }else if(data.type === "answer"){
                pc.setRemoteDescription(new RTCSessionDescription(data));
                //收到对端发送过来的SDP信息,说明协商完成
                SltBW.disabled = false;
            }else if(data.type === "candidate"){    //在双方设置完成setLocalDescription之后,双方开始交换candidate,每当收集一个candidate之后都会触发pc的onicecandidate事件
                var candidate = new RTCIceCandidate({
                    sdpMLineIndex:data.label,         //媒体行的行号 m=video ...
                    candidate:data.candidate
                });                                    //生成candidate,是从TURN/STUN服务端获取的,下面开始添加到本地pc中去,用于发送到远端
                //将candidate添加到pc
                pc.addIceCandidate(candidate);        //发送到对端,触发对端onicecandidate事件

            }else{
                console.error("the message is invalid!",data);
            }
        }
    });

    //开始发送加入消息
    socket.emit("join",roomid);
    return;
}

function getMediaStream(stream){
    localStream = stream;                //保存到全局变量,用于传输到对端
    localVideo.srcObject = localStream;    //显示在页面中,本端

    //-------与signal server进行连接,接受信令消息!!------
    conn();

    //绘制图像,渲染显示
    bitrateSeries = new TimelineDataSeries();
    bitrateGraph = new TimelineGraphView('bitrateGraph', 'bitrateCanvas');
    bitrateGraph.updateEndDate();

    packetSeries = new TimelineDataSeries();
    packetGraph = new TimelineGraphView('packetGraph', 'packetCanvas');
    packetGraph.updateEndDate();
}

function handleError(err){
    console.error(err.name+":"+err.message);
}

//初始化操作,获取本地音视频数据
function start(){
    if(!navigator.mediaDevices || !navigator.mediaDevices.getUserMedia){
        console.error("the getUserMedia is not support!");
        return;
    }else{
        var constraints = {
            video : true,
            audio : false
        };

        navigator.mediaDevices.getUserMedia(constraints)
                                .then(getMediaStream)
                                .catch(handleError);
    }

}

function connSignalServer(){
    //开启本地视频
    start();

    return true;
}

function leave(){
    if(socket){
        socket.emit("leave",roomid);
    }

    //释放资源
    closePeerConnection();
    closeLocalMedia();

    btnConn.disabled = false;
    btnLeave.disabled = true;
}

function changeBW(){
    SltBW.disabled = true;
     var bw = SltBW.options[SltBW.selectedIndex].value;
     if(bw==="unlimited"){
         return;
     }

     //获取所有的发送器
     var senders = pc.getSenders();
     var vdsender = null;
     //开始对视频流进行限流
     senders.forEach((sender)=>{
         if(sender && sender.track &&sender.track.kind === "video"){
             vdsender = sender;    //获取到视频流的sender
         }
     });

     //获取参数
     var parameters = vdsender.getParameters();
     if(!parameters.encodings){    //从编解码器中设置最大码率
         return;
     }

     parameters.encodings[0].maxBitrate = bw*1000;

     vdsender.setParameters(parameters)
                 .then(()=>{
                    SltBW.disabled = false;
                     console.log("Success to set parameters");
                 })
                 .catch(handleError);
}

//设置定时器,每秒触发
window.setInterval(()=>{
    if(!pc || !pc.getSenders())
        return;

    var sender = pc.getSenders()[0];    //因为我们只有视频流,所以不进行判断,直接去取
    if(!sender){
        return;
    }

    sender.getStats()
            .then((reports)=>{
                reports.forEach((report)=>{
                    if(report.type === "outbound-rtp"){    //获取输出带宽
                        if(report.isRemote){    //表示是远端的数据,我们只需要自己本端的
                            return;
                        }

                        var curTs = report.timestamp;
                        var bytes = report.bytesSent;
                        var packets = report.packetsSent;
                        //上面的bytes和packets是累计值。我们只需要差值
                        if(lastResult && lastResult.has(report.id)){
                            var biterate = 8*(bytes-lastResult.get(report.id).bytesSent)/(curTs-lastResult.get(report.id).timestamp);
                            var packetCnt = packets - lastResult.get(report.id).packetsSent;

                            bitrateSeries.addPoint(curTs,biterate);
                            bitrateGraph.setDataSeries([bitrateSeries]);
                            bitrateGraph.updateEndDate();

                            packetSeries.addPoint(curTs,packetCnt);
                            packetGraph.setDataSeries([packetSeries]);
                            packetGraph.updateEndDate();
                        }
                    }
                });
                lastResult = reports;
            })
            .catch(handleError);
},1000);


//设置触发事件
btnConn.onclick = connSignalServer;    //获取本地音视频数据,展示在页面,socket连接建立与信令服务器,注册信令消息处理函数,发送join信息给信令服务器
btnLeave.onclick = leave;
SltBW.onchange = changeBW;
主要逻辑:
//设置定时器,每秒触发
window.setInterval(()=>{
    if(!pc || !pc.getSenders())
        return;

    var sender = pc.getSenders()[0];    //因为我们只有视频流,所以不进行判断,直接去取
    if(!sender){
        return;
    }

    sender.getStats()
            .then((reports)=>{
                reports.forEach((report)=>{
                    if(report.type === "outbound-rtp"){    //获取输出带宽
                        if(report.isRemote){    //表示是远端的数据,我们只需要自己本端的
                            return;
                        }

                        var curTs = report.timestamp;
                        var bytes = report.bytesSent;
                        var packets = report.packetsSent;
                        //上面的bytes和packets是累计值。我们只需要差值
                        if(lastResult && lastResult.has(report.id)){
                            var biterate = 8*(bytes-lastResult.get(report.id).bytesSent)/(curTs-lastResult.get(report.id).timestamp);
                            var packetCnt = packets - lastResult.get(report.id).packetsSent;

                            bitrateSeries.addPoint(curTs,biterate);
                            bitrateGraph.setDataSeries([bitrateSeries]);
                            bitrateGraph.updateEndDate();

                            packetSeries.addPoint(curTs,packetCnt);
                            packetGraph.setDataSeries([packetSeries]);
                            packetGraph.updateEndDate();
                        }
                    }
                });
                lastResult = reports;
            })
            .catch(handleError);
},1000);
(二)结果显示