运行tensorboard.py文件后。执行下面的语句(Ubuntu中执行下面命令)会出现一个网址,复制网址在谷歌或者火狐浏览器中打卡开,就可以在tensorboard中的graph看到图
在命令行中输入
(menpo) queen@queen-X550LD:~/Downloads/py$ tensorboard --logdir logs


# -*- coding: UTF-8 -*-

import tensorflow as tf
from tensorflow.examples.tutorials.mnist import input_data

#载入数据集
mnist=input_data.read_data_sets("MNIST_data", one_hot=True)


#每个批次的大小
batch_size=100
#计算一共有多少个批次
n_batch=mnist.train.num_examples // batch_size


#命名空间
with tf.name_scope('input'):
    #定义两个placeholder
    x=tf.placeholder(tf.float32,[None,784],name = 'x-input')
    y=tf.placeholder(tf.float32,[None,10],name = 'y-input')

with tf.name_scope('layer'):
    #创建一个简单的神经网络
    with tf.name_scope('wights'):
        W=tf.Variable(tf.zeros([784,10]),name='W')
    with tf.name_scope('biase'):
        b=tf.Variable(tf.zeros([1,10]),name='b')
    with tf.name_scope('wx_plus_b'):
        wx_plus_b = tf.matmul(x,W)+b
    with tf.name_scope('softmax'):
        prediction=tf.nn.softmax(wx_plus_b)


#二次代价函数
#loss = tf.reduce_mean(tf.square(y-prediction))
#使用交叉熵代价函数
with tf.name_scope('loss'):
    loss=tf.reduce_mean(tf.nn.softmax_cross_entropy_with_logits(labels=y, logits=prediction))
#使用梯度下降法优化
with tf.name_scope('train'):
    train_step=tf.train.GradientDescentOptimizer(0.2).minimize(loss)

#初始化变量
init=tf.global_variables_initializer()

with tf.name_scope('accuracy'):
    with tf.name_scope('correct_prediction'):
        #结果放在一个布尔型列表中
        correct_prediction=tf.equal(tf.argmax(y,1), tf.argmax(prediction,1)) #argmax函数返回一维向量中最大值所在的位置
    with tf.name_scope('accuracy'):
        #求准确率
        accuracy=tf.reduce_mean(tf.cast(correct_prediction,tf.float32))

with tf.Session() as sess:
    sess.run(init)
    writer = tf.summary.FileWriter('logs/',sess.graph)# 当前文件夹下的logs文件夹,里面存放graph(图)的结构。如果当前文件夹没有logs则会自动生成
    for epoch in range(1):
        for batch in range(n_batch):#把所有图片都训练一遍
            batch_xs,batch_ys=mnist.train.next_batch(batch_size)
            sess.run(train_step,feed_dict={x:batch_xs, y:batch_ys})

        acc=sess.run(accuracy,feed_dict={x:mnist.test.images, y:mnist.test.labels})
        print("Iter"+str(epoch)+",Testing Accuracy "+str(acc))
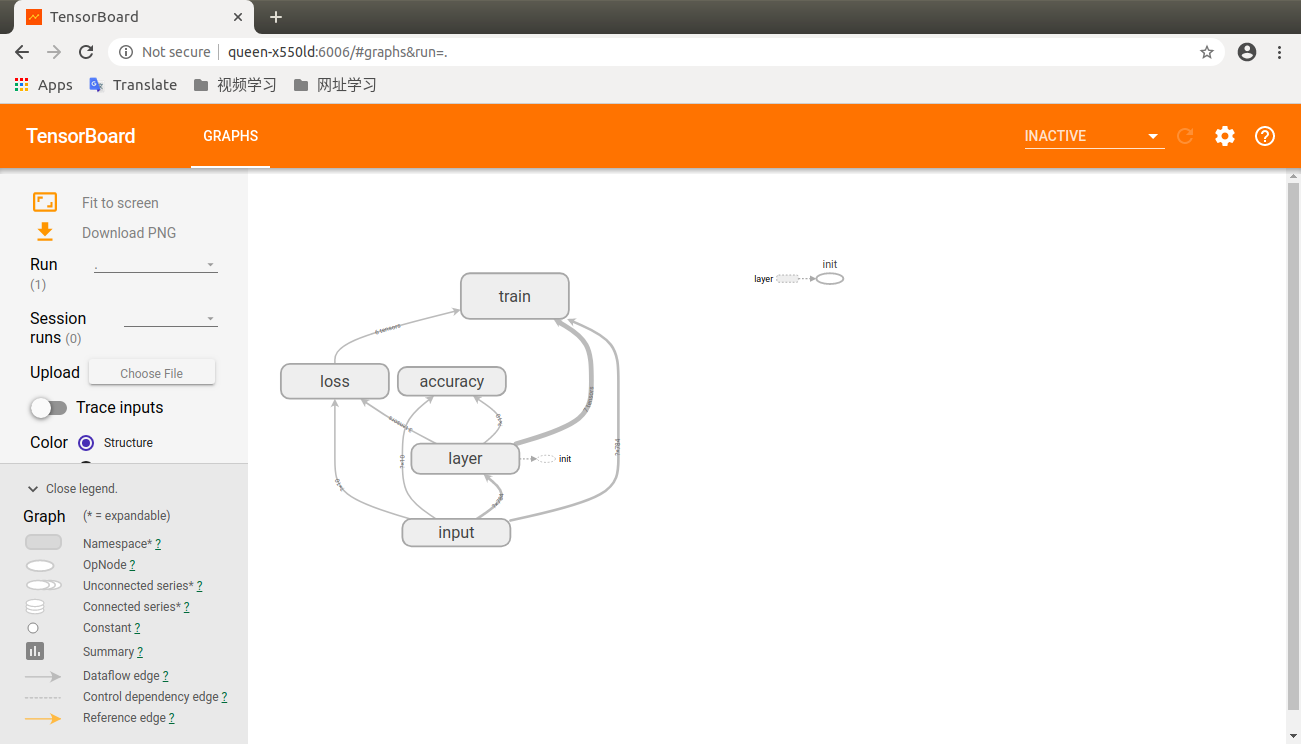
tensorboard 里面的结果如下所示