在使用fiddler代理监听访问时,可以使用statistics分页去统计请求和响应的一些信息。
界面显示如下:
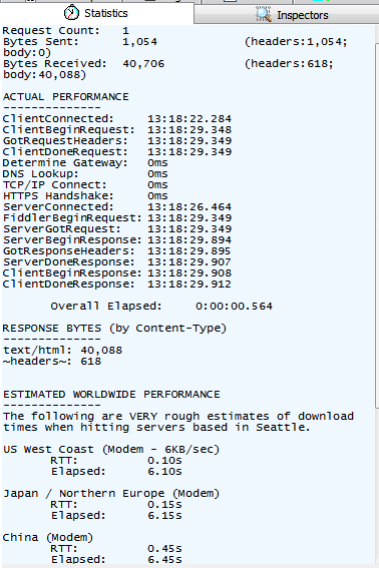

可以在这里查看一个session的统计信息
说明:
1、request count:请求数,表示该session总共发起了多少个请求。
2、Bytes sent:发送请求的字节数(包括请求头和请求体)
3、Bytes received:接收到的字节数(包括响应头和响应体)
------------------------
4、clientconnected:客户端连接的时间;
5、clientbeginrequest:客户端开始发送请求的时间;
6、gotrequestheaders:获得请求头文件的时间;
7、clientdonerequest:客户端完成请求的时间;
8、determine gateway:确定网关使用的时间;
9、dns lookup:查看dns使用的时间;
10、tcp/ip connect:tcp/ip 连接使用的时间;
11、https handshake:https握手使用的时间;
12、serverconnected:服务连接发生的时间;
13、fiddlerbeginrequest:fiddler开始请求的时间;
14、servergotrequest:服务器得到请求的时间;
15、serverbeginresponse:服务器开始响应的时间;
16、gotresponseheaders:得到响应头文件的时间;
17、serverdoneresponse:服务器完成响应的时间;
18、clientbeginresponse:客户端开始响应的时间;
19、clientdoneresponse:客户端完成响应的时间;
20、overall elapsed:全部花掉的时间(使用客户端完成响应的时间-客户端开始请求的时间)
--------------------------------
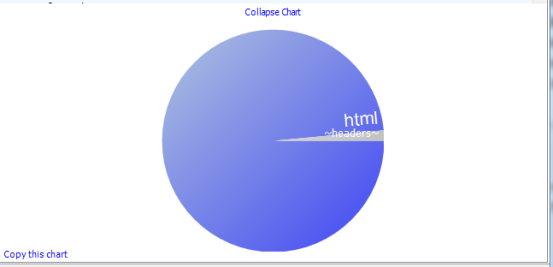
response bytes(by content-type)--响应的字节(内容格式)
------
estimated worldwide performance
(世界其他地方的性能--即其他地方访问该网站需要的时间)
可以使用statistics分页,完成简单的性能测试。查看其接口的响应时间。