我们在项目中,遇到echarts纵坐标自适应最大值与实际最大值相差太多,导致纵坐标太高
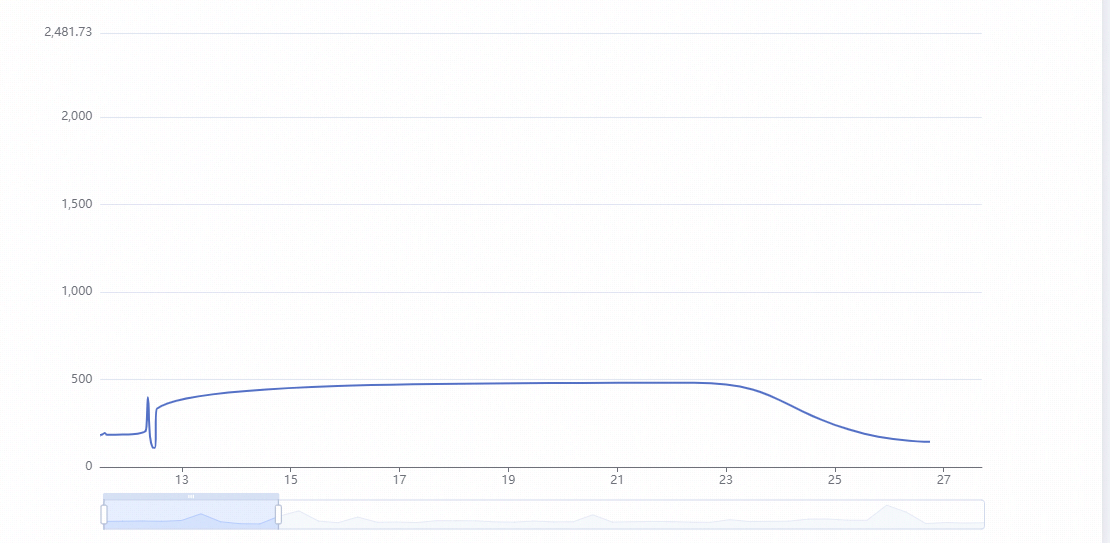
这个时候我们可以设置他的纵坐标的最大值
yAxis:{
max: function(value) {
console.log("value",value.max)
//正常情况下已经可以拿到最大值了,下面的处理是为了使得最大值是整十整百的数字,使得坐标轴美观。
  let n =  (value.max + "").split(".")[0].length // 加""是为了转化为字符串,可以使用split方法,这里是为了拿到max的整数部分
  let pow = Math.pow(10, n -1) // 10, 100, 1000,..... 这里是为了拿到
  let floorNUm =  Math.floor(value.max / pow) //1,2,3,4,5,.....,这里是为了拿到max的最高位数字
  let max = (floorNUm + 1) * pow
  console.log("max", max ? max : 200)
  return  max ? max : 200;
 }
min: function(value) {
  .....//同理拿到最小值再做一系列适合的处理
}
}