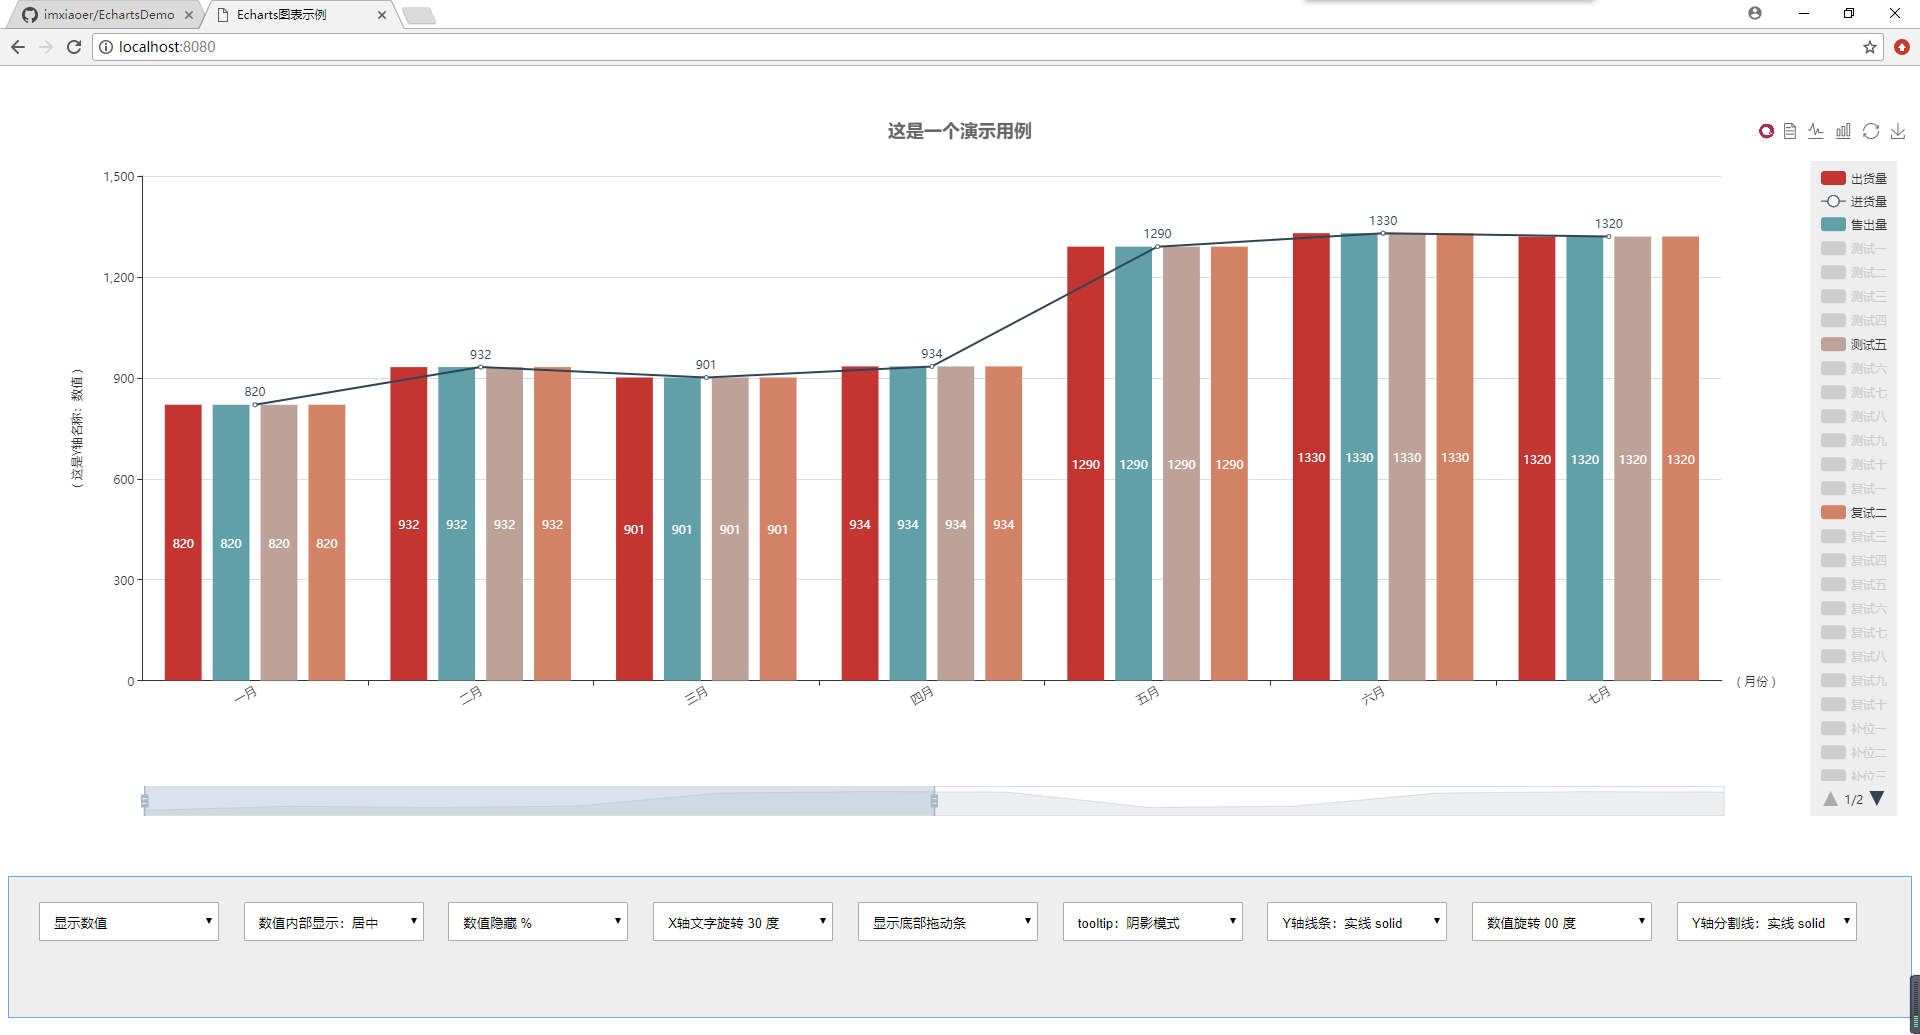
先看下效果图:

就如上图所示,都是些常用的基本配置。 Legend分页,X轴设置,Y轴设置,底部缩放条设置, 数值显示样式设置,工具箱设置,自定义工具按钮, 绑定点击事件等等。这些配置代码中都做了简单的注释。下面看下代码,代码总共分为了3个js文件,分别如下:
1. option.js
let option = {

    // 标题配置
    title: {
        text: '这是一个演示用例',
        textStyle: {
            color: '#666',  //标题字体颜色
            fontSize: 18    //标题字体大小
        },
        show: true,
        x: 'center'     //水平居中
    },

    // 画布边距设置
    grid: {
        left: '5%',
        right: '10%',
        bottom: '15%',
        containLabel: true
    },

    // 提示配置
    tooltip: {
        trigger: 'axis',
        axisPointer: {
            type: 'shadow'  // 阴影模式
        }
    },

    // 图例配置
    legend: {
        data: [
            '出货量', '进货量', '售出量', '测试一', '测试二', '测试三', '测试四', '测试五', '测试六', '测试七',
            '测试八', '测试九', '测试十', '复试一', '复试二', '复试三', '复试四', '复试五', '复试六', '复试七',
            '复试八', '复试九', '复试十', '补位一', '补位二', '补位三', '补位四', '补位五', '补位六', '补位七'
        ],
        selected: {
            '出货量': true, '进货量': true, '售出量': true, '测试一': false, '测试二': false, '测试三': false,
            '测试四': false, '测试五': true, '测试六': false, '测试七': false, '测试八': false, '测试九': false,
            '测试十': false, '复试一': false, '复试二': true, '复试三': false, '复试四': false, '复试五': false,
            '复试六': false, '复试七': false, '复试八': false, '复试九': false, '复试十': false, '补位一': false,
            '补位二': false, '补位三': false, '补位四': false, '补位五': false, '补位六': false, '补位七': false
        },
        show: true,
        type: 'scroll',     //启用翻页模式
        orient: 'vertical', //纵向显示
        right: 15,
        top: 45,
        backgroundColor: '#eee',
        padding: 10
    },

    // 工具箱配置
    toolbox: {
        feature: {

            // 自定义工具按钮,注:自定义按钮必须以 my 开头
            myTool: {
                show: true,
                title: '自定义扩展方法',
                icon: 'image://http://echarts.baidu.com/images/favicon.png',    //注: image:// 这个是固定格式,后面跟图片地址
                onclick: () => {
                    alert('您刚刚点击了自定义工具按钮!');
                }
            },

            // 显示数据视图
            dataView: {

                // 只读,注:只读模式下不会出现【刷新】按钮,只显示【关闭】按钮
                readOnly: true,

                // 重写数据视图样式,改为表格(默认是一个多行文本框,即:<textarea>)
                optionToContent: (opt) => {
                    let axisData = opt.xAxis[0].data,
                        series = opt.series,
                        html = '<table class="echarts-table"><thead><tr><th>系列/月份</th>';

                    // 表头
                    for(let th of axisData) {
                        html += `<th>${th}</th>`;
                    }
                    html += '</tr></thead><tbody>';

                    // 表体
                    for(let tr of series) {
                        html += `<tr><td>${tr.name}</td>`;
                        for(let td of tr.data) {
                            html += `<td>${td}</td>`;
                        }
                        html += '</tr>';
                    }
                    html += '</tbody></table>';
                    return html;
                }
            },

            // 线形图和柱状图的切换
            magicType: {
                type: ['line', 'bar'],
                title: {
                    line: '折线图',
                    bar: '柱状图',
                }
            },

            restore: {},        // 还原
            saveAsImage: {}     // 保存为图片
        }
    },

    // X轴配置
    xAxis: {
        name: '( 月份 )',
        type: 'category',
        axisLabel: {
            rotate: 30  // X轴文字旋转角度
        },
        data: ['一月', '二月', '三月', '四月', '五月', '六月', '七月', '八月', '九月', '十月', '十一月', '十二月']
    },

    // Y轴配置
    yAxis: {
        name: '( 这是Y轴名称:数值 )',
        nameLocation: 'middle',         // 居中
        nameGap: 60,                    // 与轴线之间的间距
        nameRotate: 90,                 // 字体旋转角度
        type: 'value',

        // Y轴线条设置
        axisLine: {
            show: true,
            lineStyle: {
                type: 'solid'
            }
        },

        // Y轴分割线设置
        splitLine: {
            show: true,
            lineStyle: {
                color: '#ddd',
                type: 'solid'
            }
        }
    },

    // 底部缩放条配置
    dataZoom: [{
        type: 'slider',
        start: 0,
        end: 50,
        bottom: 0,
        show: true
    }],

    // 系列数据配置
    series: [{
        name: '出货量',
        data: [820, 932, 901, 934, 1290, 1330, 1320, 901, 934, 1290, 1330, 1320],
        type: 'bar',
        label: {
            show: true
        }
    }, {
        name: '进货量',
        data: [820, 932, 901, 934, 1290, 1330, 1320, 901, 934, 1290, 1330, 1320],
        type: 'line',
        label: {
            show: true
        }
    }, {
        name: '售出量',
        data: [820, 932, 901, 934, 1290, 1330, 1320, 901, 934, 1290, 1330, 1320],
        type: 'bar',
        label: {
            show: true
        }
    }, {
        name: '测试一',
        data: [820, 932, 901, 934, 1290, 1330, 1320, 901, 934, 1290, 1330, 1320],
        type: 'bar',
        label: {
            show: true
        }
    }, {
        name: '测试二',
        data: [820, 932, 901, 934, 1290, 1330, 1320, 901, 934, 1290, 1330, 1320],
        type: 'bar',
        label: {
            show: true
        }
    }, {
        name: '测试三',
        data: [820, 932, 901, 934, 1290, 1330, 1320, 901, 934, 1290, 1330, 1320],
        type: 'bar',
        label: {
            show: true
        }
    }, {
        name: '测试四',
        data: [820, 932, 901, 934, 1290, 1330, 1320, 901, 934, 1290, 1330, 1320],
        type: 'bar',
        label: {
            show: true
        }
    }, {
        name: '测试五',
        data: [820, 932, 901, 934, 1290, 1330, 1320, 901, 934, 1290, 1330, 1320],
        type: 'bar',
        label: {
            show: true
        }
    }, {
        name: '测试六',
        data: [820, 932, 901, 934, 1290, 1330, 1320, 901, 934, 1290, 1330, 1320],
        type: 'bar',
        label: {
            show: true
        }
    }, {
        name: '测试七',
        data: [820, 932, 901, 934, 1290, 1330, 1320, 901, 934, 1290, 1330, 1320],
        type: 'bar',
        label: {
            show: true
        }
    }, {
        name: '测试八',
        data: [820, 932, 901, 934, 1290, 1330, 1320, 901, 934, 1290, 1330, 1320],
        type: 'bar',
        label: {
            show: true
        }
    }, {
        name: '测试九',
        data: [820, 932, 901, 934, 1290, 1330, 1320, 901, 934, 1290, 1330, 1320],
        type: 'bar',
        label: {
            show: true
        }
    }, {
        name: '测试十',
        data: [820, 932, 901, 934, 1290, 1330, 1320, 901, 934, 1290, 1330, 1320],
        type: 'bar',
        label: {
            show: true
        }
    }, {
        name: '复试一',
        data: [820, 932, 901, 934, 1290, 1330, 1320, 901, 934, 1290, 1330, 1320],
        type: 'bar',
        label: {
            show: true
        }
    }, {
        name: '复试二',
        data: [820, 932, 901, 934, 1290, 1330, 1320, 901, 934, 1290, 1330, 1320],
        type: 'bar',
        label: {
            show: true
        }
    }, {
        name: '复试三',
        data: [820, 932, 901, 934, 1290, 1330, 1320, 901, 934, 1290, 1330, 1320],
        type: 'bar',
        label: {
            show: true
        }
    }, {
        name: '复试四',
        data: [820, 932, 901, 934, 1290, 1330, 1320, 901, 934, 1290, 1330, 1320],
        type: 'bar',
        label: {
            show: true
        }
    }, {
        name: '复试五',
        data: [820, 932, 901, 934, 1290, 1330, 1320, 901, 934, 1290, 1330, 1320],
        type: 'bar',
        label: {
            show: true
        }
    }, {
        name: '复试六',
        data: [820, 932, 901, 934, 1290, 1330, 1320, 901, 934, 1290, 1330, 1320],
        type: 'bar',
        label: {
            show: true
        }
    }, {
        name: '复试七',
        data: [820, 932, 901, 934, 1290, 1330, 1320, 901, 934, 1290, 1330, 1320],
        type: 'bar',
        label: {
            show: true
        }
    }, {
        name: '复试八',
        data: [820, 932, 901, 934, 1290, 1330, 1320, 901, 934, 1290, 1330, 1320],
        type: 'bar',
        label: {
            show: true
        }
    }, {
        name: '复试九',
        data: [820, 932, 901, 934, 1290, 1330, 1320, 901, 934, 1290, 1330, 1320],
        type: 'bar',
        label: {
            show: true
        }
    }, {
        name: '复试十',
        data: [820, 932, 901, 934, 1290, 1330, 1320, 901, 934, 1290, 1330, 1320],
        type: 'bar',
        label: {
            show: true
        }
    }, {
        name: '补位一',
        data: [820, 932, 901, 934, 1290, 1330, 1320, 901, 934, 1290, 1330, 1320],
        type: 'bar',
        label: {
            show: true
        }
    }, {
        name: '补位二',
        data: [820, 932, 901, 934, 1290, 1330, 1320, 901, 934, 1290, 1330, 1320],
        type: 'bar',
        label: {
            show: true
        }
    }, {
        name: '补位三',
        data: [820, 932, 901, 934, 1290, 1330, 1320, 901, 934, 1290, 1330, 1320],
        type: 'bar',
        label: {
            show: true
        }
    }, {
        name: '补位四',
        data: [820, 932, 901, 934, 1290, 1330, 1320, 901, 934, 1290, 1330, 1320],
        type: 'bar',
        label: {
            show: true
        }
    }, {
        name: '补位五',
        data: [820, 932, 901, 934, 1290, 1330, 1320, 901, 934, 1290, 1330, 1320],
        type: 'bar',
        label: {
            show: true
        }
    }, {
        name: '补位六',
        data: [820, 932, 901, 934, 1290, 1330, 1320, 901, 934, 1290, 1330, 1320],
        type: 'bar',
        label: {
            show: true
        }
    }, {
        name: '补位七',
        data: [820, 932, 901, 934, 1290, 1330, 1320, 901, 934, 1290, 1330, 1320],
        type: 'bar',
        label: {
            show: true
        }
    }]
};

export default option;
2. demo.js
// 示例图-操作类
export default class Demo {

    // 构造函数
    constructor(option, echarts) {
        this.option = option;
        this.echarts = echarts;
    }

    // 初始化图表
    init() {
        this.echarts.setOption(this.option, true);
    }

    // X轴坐标文字旋转角度
    xTextRotate(deg) {
        this.option.xAxis.axisLabel.rotate = parseInt(deg, 10);
        this.init();
    }

    // 系列数值的显示位置
    seriesLabelPosition(position) {
        let series = this.option.series;
        let newSeries = series.map((item) => {
            item.label.position = position;
            return item;
        });
        this.option.series = newSeries;
        this.init();
    }

    // 系列数值是否显示
    seriesLabelDisplay(mark) {
        let series = this.option.series;
        let newSeries = series.map((item) => {
            item.label.show = mark;
            return item;
        });
        this.option.series = newSeries;
        this.init();
    }

    // 系列数值 %
    seriesLabelWithPercent(mark) {
        let series = this.option.series;
        let newSeries = series.map((item) => {
            item.label.formatter = mark ? '{c}%' : '{c}';
            return item;
        });
        this.option.series = newSeries;
        this.init();
    }

    // 系列数值旋转
    seriesLabelRotate(deg) {
        let series = this.option.series;
        let newSeries = series.map((item) => {
            item.label.rotate = parseInt(deg, 10);
            return item;
        });
        this.option.series = newSeries;
        this.init();
    }

    // 底部拖动条是否显示
    dataZoomDisplay(mark) {
        if(mark) {
            this.option.dataZoom[0].show = true;
            this.option.dataZoom[0].end = 50;
        } else {
            this.option.dataZoom[0].show = false;
            this.option.dataZoom[0].end = 100;
        }
        this.init();
    }

    // 提示模式
    tooltipModel(model) {
        this.option.tooltip.axisPointer.type = model;
        this.init();
    }

    // Y轴线条
    yLineStyle(style) {
        if(style === 'none') {
            this.option.yAxis.axisLine.show = false;
        } else {
            this.option.yAxis.axisLine.show = true;
            this.option.yAxis.axisLine.lineStyle.type = style;
        }
        this.init();
    }

    // Y轴分割线
    ySplitLineStyle(style) {
        if(style === 'none') {
            this.option.yAxis.splitLine.show = false;
        } else {
            this.option.yAxis.splitLine.show = true;
            this.option.yAxis.splitLine.lineStyle.type = style;
        }
        this.init();
    }

    // 绑定事件
    bindEvent(eventName, eventAction) {
        this.echarts.on(eventName, eventAction);
    }

    // 自适应调整
    resize() {
        this.echarts.resize();
    }
}
3. index.js
import echarts from 'echarts';
import option from './option';
import Demo from './demo';

// 根据id获取元素
let $ = id => document.getElementById(id);

// 初始化图表
let demo = new Demo(option, echarts.init($('echarts')));
demo.init();

// 是否显示数值
$('sel1').addEventListener('change', (e) => {
    demo.seriesLabelDisplay(e.target.value === '1');
});

// 数值显示位置
$('sel2').addEventListener('change', (e) => {
    demo.seriesLabelPosition(e.target.value);
});

// 数值 %
$('sel3').addEventListener('change', (e) => {
    demo.seriesLabelWithPercent(e.target.value === '1');
});

// X轴文字旋转角度
$('sel4').addEventListener('change', (e) => {
    demo.xTextRotate(e.target.value);
});

// 底部拖动条是否显示
$('sel5').addEventListener('change', (e) => {
    demo.dataZoomDisplay(e.target.value === '1');
});

// 设置提示模式
$('sel6').addEventListener('change', (e) => {
    demo.tooltipModel(e.target.value);
});

// Y轴线条
$('sel7').addEventListener('change', (e) => {
    demo.yLineStyle(e.target.value);
});

// 数值旋转
$('sel8').addEventListener('change', (e) => {
    demo.seriesLabelRotate(e.target.value);
});

// Y轴分割线
$('sel9').addEventListener('change', (e) => {
    demo.ySplitLineStyle(e.target.value);
});

// 绑定点击事件
demo.bindEvent('click', (param) => {
    alert(`${param.name} - ${param.seriesName} - ${param.data}`);
});

// 浏览器窗口大小改变时,图表自适应
window.addEventListener('resize', () => { demo.resize(); });
option.js 是echarts的配置项,单独一个配置对象。 demo.js是一个类,里面定义了一些方法用来操作图表,改变图表的一些样式和 行为。 index.js是实际页面调用的js文件,它引入了option.js 和 demo.js。因为用了webpack 进行打包,打包后的文件名为bundle.js,所以index.html文件只引用了一个bundle.js文件。
index.html
<!DOCTYPE html>
<html lang="en">

<head>
    <meta charset="UTF-8">
    <meta name="viewport" content="width=device-width, initial-scale=1.0">
    <meta http-equiv="X-UA-Compatible" content="ie=edge">
    <title>Echarts图表示例</title>
    <style>
        .echarts {
            width: 100%;
            height: 700px;
            margin-top: 50px;
            padding-bottom: 10px;
        }
        .operate {
            margin-top: 50px;
            min-height: 100px;
            background-color: #eee;
            padding: 20px;
            border: 1px solid #69a5e9;
        }
        select, button {
            padding: 10px;
            width: 180px;
            margin: 5px 10px;
        }
        .echarts-table {
            width: 100%;
            border-collapse: collapse;
        }
        .echarts-table thead {
            background-color: #eee;
        }
        .echarts-table th, .echarts-table td {
            border: 1px solid #ddd;
            text-align: center;
            padding: 10px 0;
        }
    </style>
</head>

<body>
    <div id="echarts" class="echarts"></div>
    <div class="operate">
        <select name="sel1" id="sel1">
            <option value="1">显示数值</option>
            <option value="0">隐藏数值</option>
        </select>
        <select name="sel2" id="sel2">
            <option value="inside">数值内部显示:居中</option>
            <option value="insideBottom">数值内部显示:底部</option>
            <option value="top">数值外部显示:顶部</option>
        </select>
        <select name="sel3" id="sel3">
            <option value="0">数值隐藏 %</option>
            <option value="1">数值添加 %</option>
        </select>
        <select name="sel4" id="sel4">
            <option value="0">X轴文字旋转 00 度</option>
            <option value="30" selected>X轴文字旋转 30 度</option>
            <option value="60">X轴文字旋转 60 度</option>
            <option value="90">X轴文字旋转 90 度</option>
        </select>
        <select name="sel5" id="sel5">
            <option value="1">显示底部拖动条</option>
            <option value="0">隐藏底部拖动条</option>
        </select>
        <select name="sel6" id="sel6">
            <option value="shadow">tooltip:阴影模式</option>
            <option value="line">tooltip:线条模式</option>
            <option value="cross">tooltip:交叉模式</option>
        </select>
        <select name="sel7" id="sel7">
            <option value="none">Y轴线条:隐藏</option>
            <option value="solid" selected>Y轴线条:实线 solid</option>
            <option value="dashed">Y轴线条:虚线 dashed</option>
            <option value="dotted">Y轴线条:虚线 dotted</option>
        </select>
        <select name="sel8" id="sel8">
            <option value="0">数值旋转 00 度</option>
            <option value="30">数值旋转 30 度</option>
            <option value="60">数值旋转 60 度</option>
            <option value="90">数值旋转 90 度</option>
        </select>
        <select name="sel9" id="sel9">
            <option value="none">Y轴分割线:隐藏</option>
            <option value="solid" selected>Y轴分割线:实线 solid</option>
            <option value="dashed">Y轴分割线:虚线 dashed</option>
            <option value="dotted">Y轴分割线:虚线 dotted</option>
        </select>
    </div>
    <script src="bundle.js"></script>
</body>

</html>
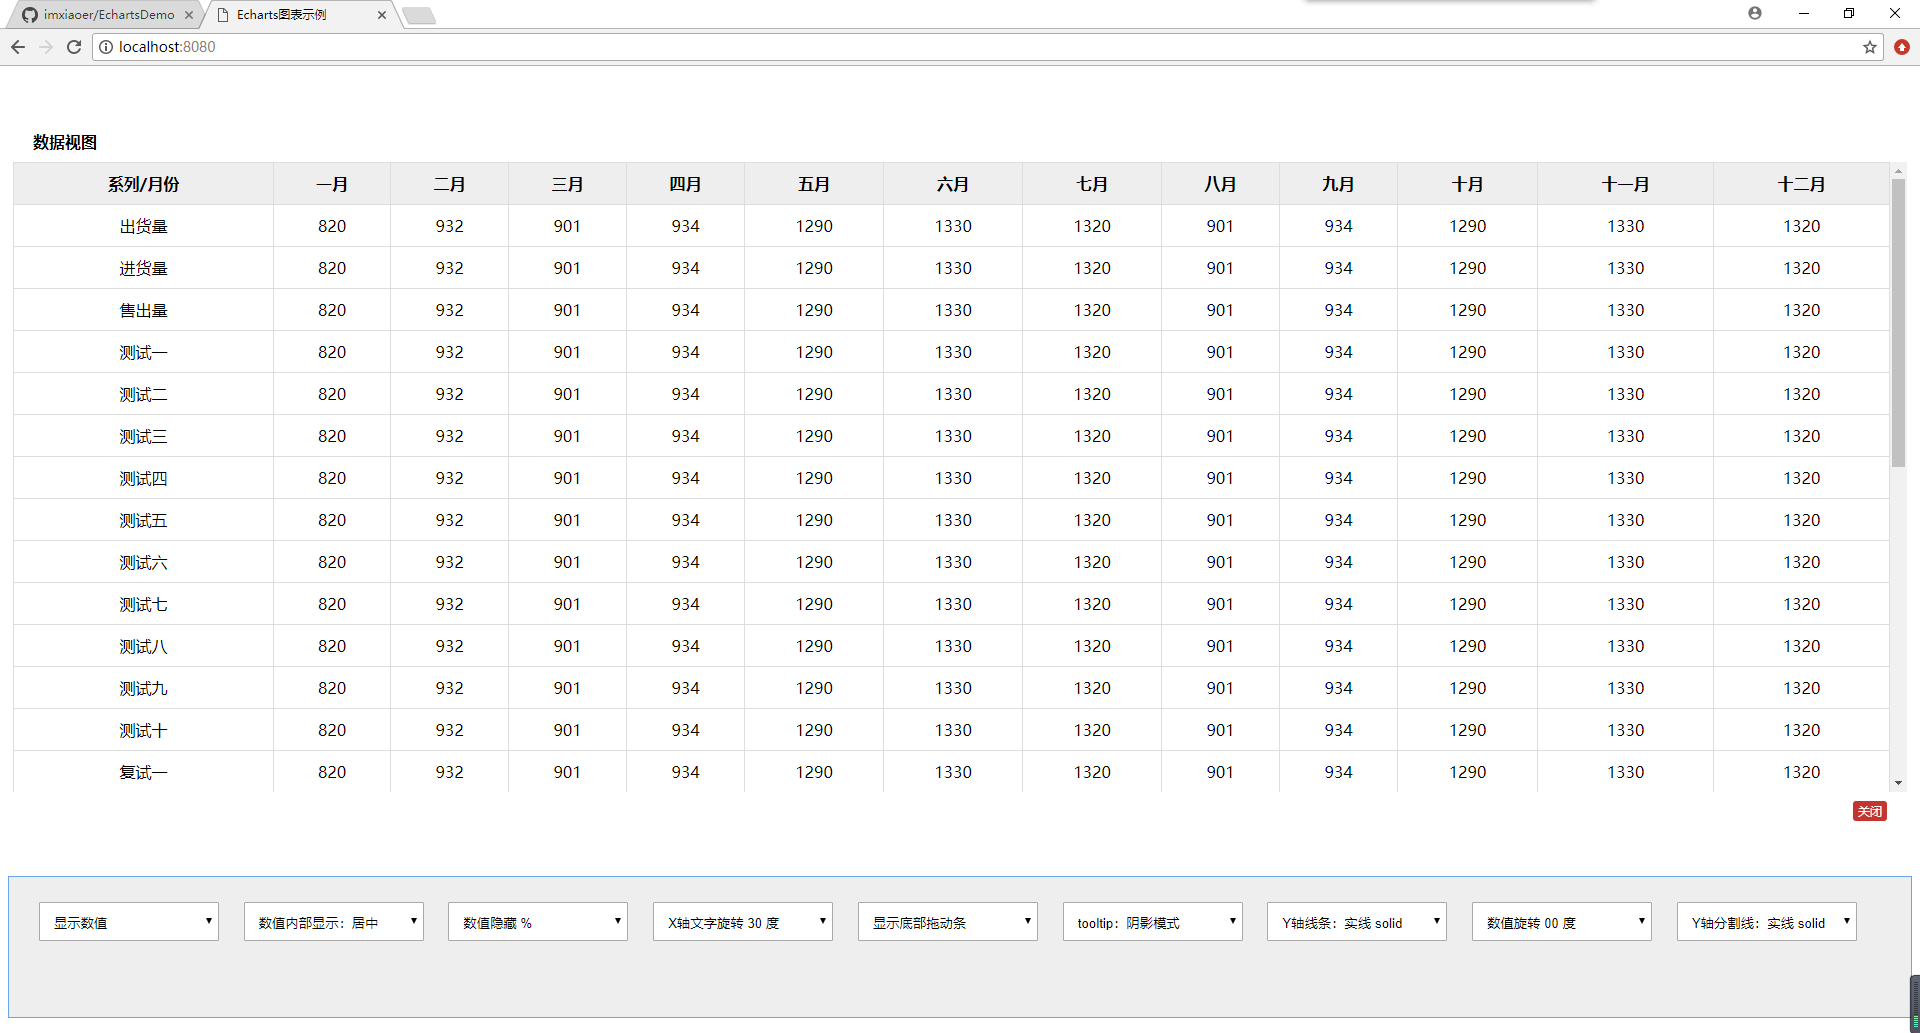
以上就是所有的代码了,用的ES6的语法。echarts 工具箱 (toolbox) 中的数据视图按钮点击后出现的数据视图我嫌弃它太丑了,所以重新写了样式。默认情况下它是一个可编辑的多行文本框,在option.js中重新拼成了table。 效果如下图:
