现实世界的曲线关系都是通过增加多项式实现的,现在解决多项式回归问题
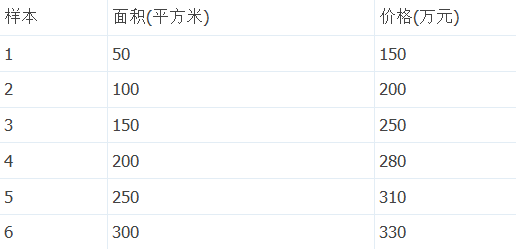
住房价格样本

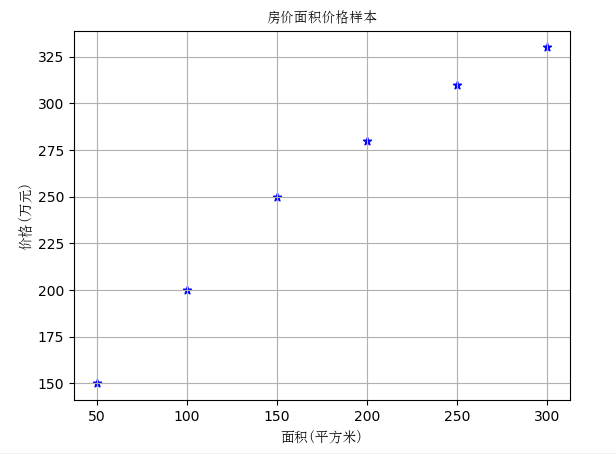
样本图像
import matplotlib.font_manager as fm
import matplotlib.pyplot as plt
myfont = fm.FontProperties(fname='C:WindowsFontssimsun.ttc')
# plt.figure()  # 实例化作图变量
plt.title('房价面积价格样本', fontproperties = myfont)  # 图像标题
plt.xlabel('面积(平方米)', fontproperties = myfont)  # x轴文本
plt.ylabel('价格(万元)', fontproperties = myfont)  # y轴文本
# plt.axis([30, 400, 100, 400])
plt.grid(True)  # 是否绘制网格线

X = [[50], [100], [150], [200], [250], [300]]
y = [[150], [200], [250], [280], [310], [330]]

X_test = [[250], [300]]  # 用来做最终效果测试
y_test = [[310], [330]]  # 用来做最终效果测试
# plt.plot(X, y, 'b.')#点
# plt.plot(X, y, 'b-')#线
plt.scatter(X, y, marker='*',color='blue',label='房价面积价格样本')
plt.show()

用线性回归
添加以下代码
model = LinearRegression()
model.fit(X, y)
print('一元线性回归 r-squared', model.score(X_test, y_test))

X2 = [[30], [400]]
y2 = model.predict(X2)
plt.plot(X2, y2, 'g-')
plt.show()

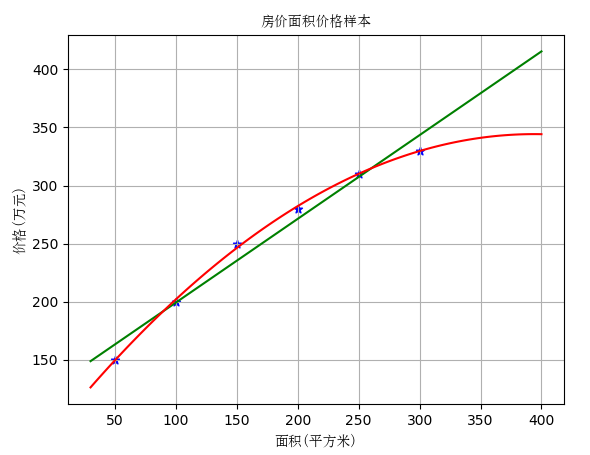
实际情况是,如果房屋面积一味的增加,房价并不会线性增长,因此线性关系已经无法描述真实的房价问题
采用多项式回归
首先我们用二次多项式
# 实例化一个二次多项式特征实例
quadratic_featurizer = PolynomialFeatures(degree=2)

# 用二次多项式对样本X值做变换
X_train_quadratic = quadratic_featurizer.fit_transform(X)

# 创建一个线性回归实例
regressor_model = LinearRegression()

# 以多项式变换后的x值为输入,代入线性回归模型做训练
regressor_model.fit(X_train_quadratic, y)

# 设计x轴一系列点作为画图的x点集
xx = np.linspace(30, 400, 100)

# 把训练好X值的多项式特征实例应用到一系列点上,形成矩阵
xx_quadratic = quadratic_featurizer.transform(xx.reshape(xx.shape[0], 1))

yy_predict = regressor_model.predict(xx_quadratic)

# 用训练好的模型作图
plt.plot(xx, yy_predict, 'r-')


X_test_quadratic = quadratic_featurizer.transform(X_test)
print('二次回归     r-squared', regressor_model.score(X_test_quadratic, y_test))
#
#
plt.show()  # 展示图像

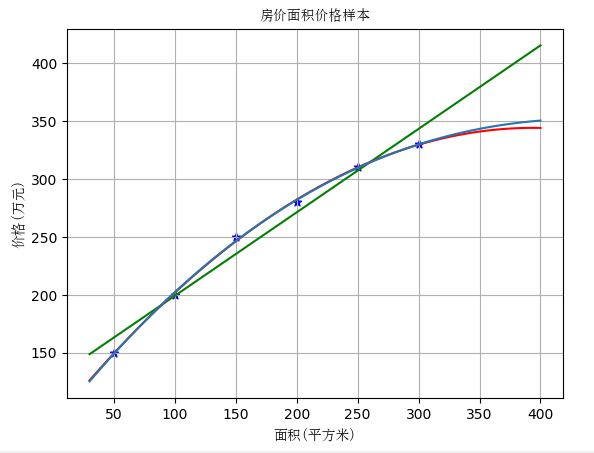
继续三次回归
cubic_featurizer = PolynomialFeatures(degree=3)
X_train_cubic = cubic_featurizer.fit_transform(X)
regressor_cubic = LinearRegression()
regressor_cubic.fit(X_train_cubic, y)
xx_cubic = cubic_featurizer.transform(xx.reshape(xx.shape[0], 1))
plt.plot(xx, regressor_cubic.predict(xx_cubic))

X_test_cubic = cubic_featurizer.transform(X_test)
print('三次回归     r-squared', regressor_cubic.score(X_test_cubic, y_test))
plt.show()  # 展示图像


可以看到三次回归比二次回归效果又好了一些,但是不是很明显。所以二次回归更可能是最适合的回归模型,三次回归可能有过拟合现象
参考:http://www.aboutyun.com/thread-19073-1-1.html