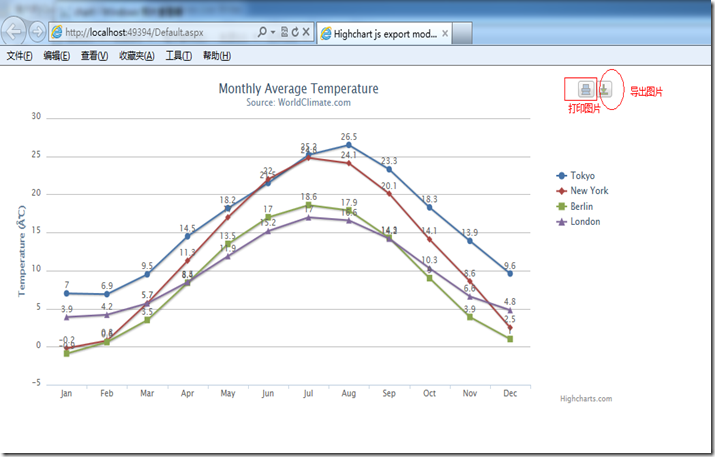
Highcharts是一个制作图表的纯Javascript类库,主要特性如下:
- 兼容性:兼容当今所有的浏览器,包括iPhone、IE和火狐等等;
- 对个人用户完全免费;
- 纯JS,无BS;
- 支持大部分的图表类型:直线图,曲线图、区域图、区域曲线图、柱状图、饼装图、散布图;
- 跨语言:不管是PHP、Asp.net还是Java都可以使用,它只需要三个文件:一个是Highcharts的核心文件highcharts.js,还有a canvas emulator for IE和Jquery类库或者MooTools类库;
- 提示功能:鼠标移动到图表的某一点上有提示信息;
- 放大功能:选中图表部分放大,近距离观察图表;
- 易用性:无需要特殊的开发技能,只需要设置一下选项就可以制作适合自己的图表;
- 时间轴:可以精确到毫秒
下载插件
Highcharts下载地址
http://www.highcharts.com/download
jquery下载地址
本次介绍是把highcharts中的第一个文件拷贝过来,然后把其他的功能加在了这个文件中,然后查询相关资料,导出图片格式不需要连到官方服务器了,只需要在本地就可以。
<%@ Page Language="C#" AutoEventWireup="true" CodeBehind="Default.aspx.cs" Inherits="highchart_export_module_asp_net._Default" %>
<!DOCTYPE html PUBLIC "-//W3C//DTD XHTML 1.0 Transitional//EN" "http://www.w3.org/TR/xhtml1/DTD/xhtml1-transitional.dtd">
<html xmlns="http://www.w3.org/1999/xhtml">
<head runat="server">
<title>Highchart js export module sample</title>
<!-- 1.引入jquery库 -->
<script src="Javascript/jquery-1.5.1.js" type="text/javascript"></script>
<!-- 2.引入highcharts的核心文件 -->
<script src="http://highcharts.com/js/highcharts.js" type="text/javascript"></script>
<!-- 3.引入导出需要的js库文件 -->
<script src="http://highcharts.com/js/modules/exporting.js" type="text/javascript"></script>
</head>
<script language="javascript" type="text/javascript">
var chart;
$(document).ready(function () {
chart = new Highcharts.Chart({
chart: {
renderTo: 'container',
defaultSeriesType: 'line', //图表类别,可取值有:line、spline、area、areaspline、bar、column等
marginRight: 130,
marginBottom: 25
},
title: {
text: 'Monthly Average Temperature', //设置一级标题
x: -20 //center
},
subtitle: {
text: 'Source: WorldClimate.com', //设置二级标题
x: -20
},
xAxis: {
categories: ['Jan', 'Feb', 'Mar', 'Apr', 'May', 'Jun',
'Jul', 'Aug', 'Sep', 'Oct', 'Nov', 'Dec']//设置x轴的标题
},
yAxis: {
title: {
text: 'Temperature (°C)' //设置y轴的标题
},
plotLines: [{
value: 0,
1,
color: '#808080'
}]
},
tooltip: {
formatter: function () {
return '<b>' + this.series.name + '</b><br/>' +
this.x + ': ' + this.y + '°C'; //鼠标放在数据点的显示信息,但是当设置显示了每个节点的数据项的值时就不会再有这个显示信息
}
},
legend: {
layout: 'vertical',
align: 'right', //设置说明文字的文字 left/right/top/
verticalAlign: 'top',
x: -10,
y: 100,
borderWidth: 0
},
exporting: {
enabled: true, //用来设置是否显示‘打印’,'导出'等功能按钮,不设置时默认为显示
url: "http://localhost:49394/highcharts_export.aspx" //导出图片的URL,默认导出是需要连到官方网站去的哦
},
plotOptions: {
line: {
dataLabels: {
enabled: true //显示每条曲线每个节点的数据项的值
},
enableMouseTracking: false
}
},
series: [{
name: 'Tokyo', //每条线的名称
data: [7.0, 6.9, 9.5, 14.5, 18.2, 21.5, 25.2, 26.5, 23.3, 18.3, 13.9, 9.6]//每条线的数据
}, {
name: 'New York',
data: [-0.2, 0.8, 5.7, 11.3, 17.0, 22.0, 24.8, 24.1, 20.1, 14.1, 8.6, 2.5]
}, {
name: 'Berlin',
data: [-0.9, 0.6, 3.5, 8.4, 13.5, 17.0, 18.6, 17.9, 14.3, 9.0, 3.9, 1.0]
}, {
name: 'London',
data: [3.9, 4.2, 5.7, 8.5, 11.9, 15.2, 17.0, 16.6, 14.2, 10.3, 6.6, 4.8]
}]
});
});
</script>
<body>
<form id="form1" runat="server">
<!--5.导入容器用于显示图表-->
<div id="container" style=" 900px;">
</div>
</form>
</body>
</html>
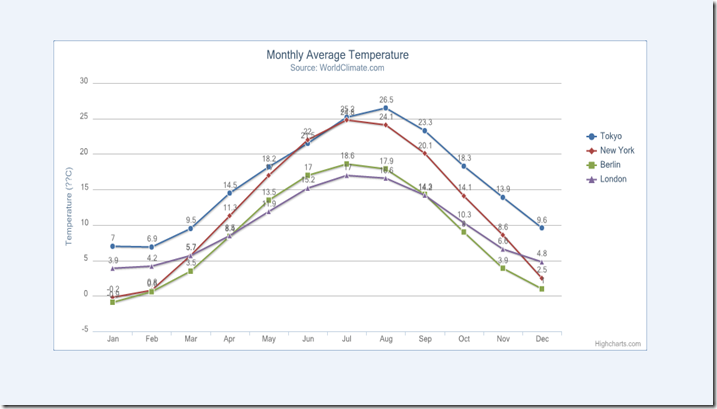
导出的图片格式
可以做到页面展示和导出的图片一致了。
参考文章:


