一个简单的程序
这里使用Python3语言,创建虚拟环境,并安装prometheus_client
mkvirtualenv --python "/usr/local/python36/bin/python3" prom
pip install prometheus_client
编写一个简单的HTTP服务器(运行在192.168.88.50上)
import http.server
from prometheus_client import start_http_server

class MyHandler(http.server.BaseHTTPRequestHandler):
    def do_GET(self):
        self.send_response(200)
        self.end_headers()
        self.wfile.write(b"Hello world")

if __name__  == "__main__":
    start_http_server(8000) # 在8000端口上启动一个http服务器给promethes metrics 提供服务
    server = http.server.HTTPServer(('localhost', 8001), MyHandler)
    server.serve_forever()
访问http://192.168.88.50:8000/metrics查看
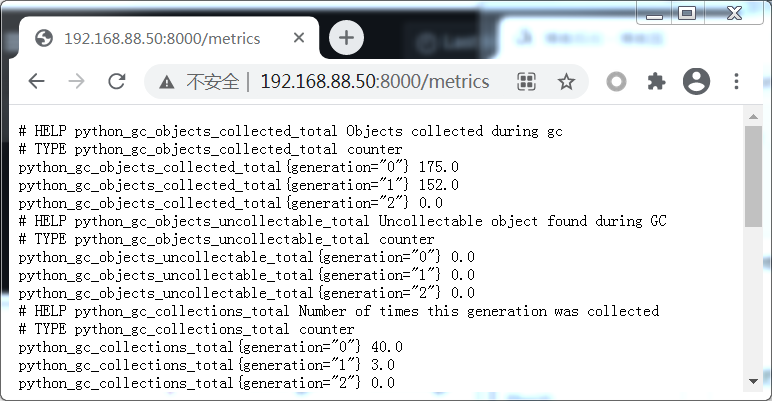
可以把它配置到prometheus服务中, 编辑prometheus.yml,添加如下配置, 并重启prometheus
  - job_name: "demo"
    static_configs:
    - targets:
      - "192.168.88.50:8000"
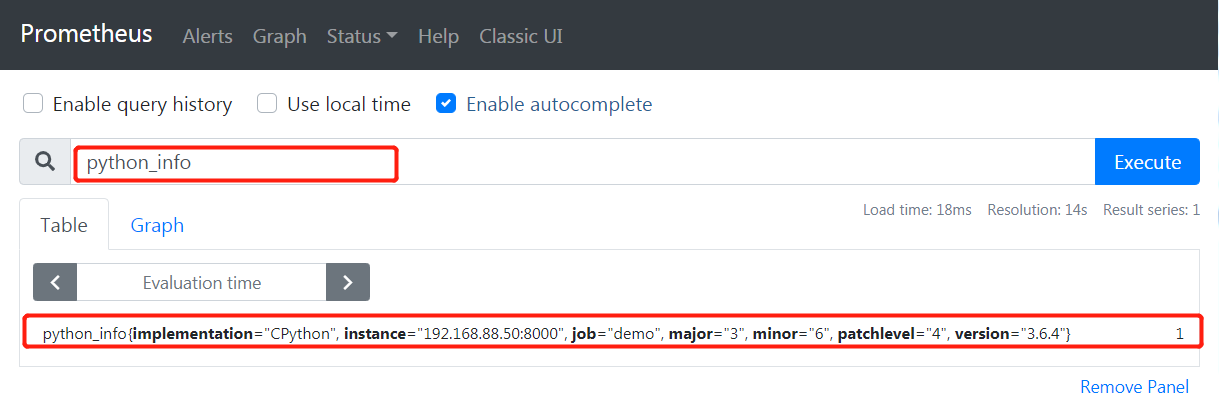
现在我们可以从prometheus中获取指标数据
Counter
counter是一种会经常使用到指标类型,只增不减(除非发生重置),例如我们可以在应用程序中记录某些事件发生的次数,通过以时序的形式存储这些数据,我们可以轻松的了解该事件产生速率的变化。
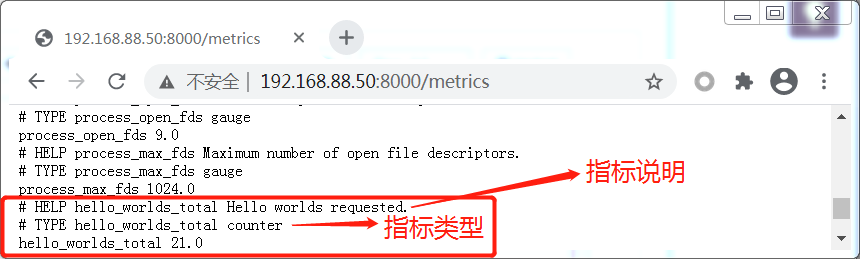
扩展前面的代码,增加一个新的mertic: 请求Hello World的次数
from prometheus_client import Counter

# 第1个参数是mertic name必须是唯一的, 第二个参数是对mertic的描述
REQUESTS = Counter('hello_worlds_total', 'Hello worlds requested.')

class MyHandler(http.server.BaseHTTPRequestHandler):
    def do_GET(self):
        REQUESTS.inc()  # 递增
        self.send_response(200)
        self.end_headers()
        self.wfile.write(b"Hello world")
当我们在192.168.88.50上每访问一次(curl http://127.0.0.1:8001), 则 'hello_worlds_total'的值就是增加1
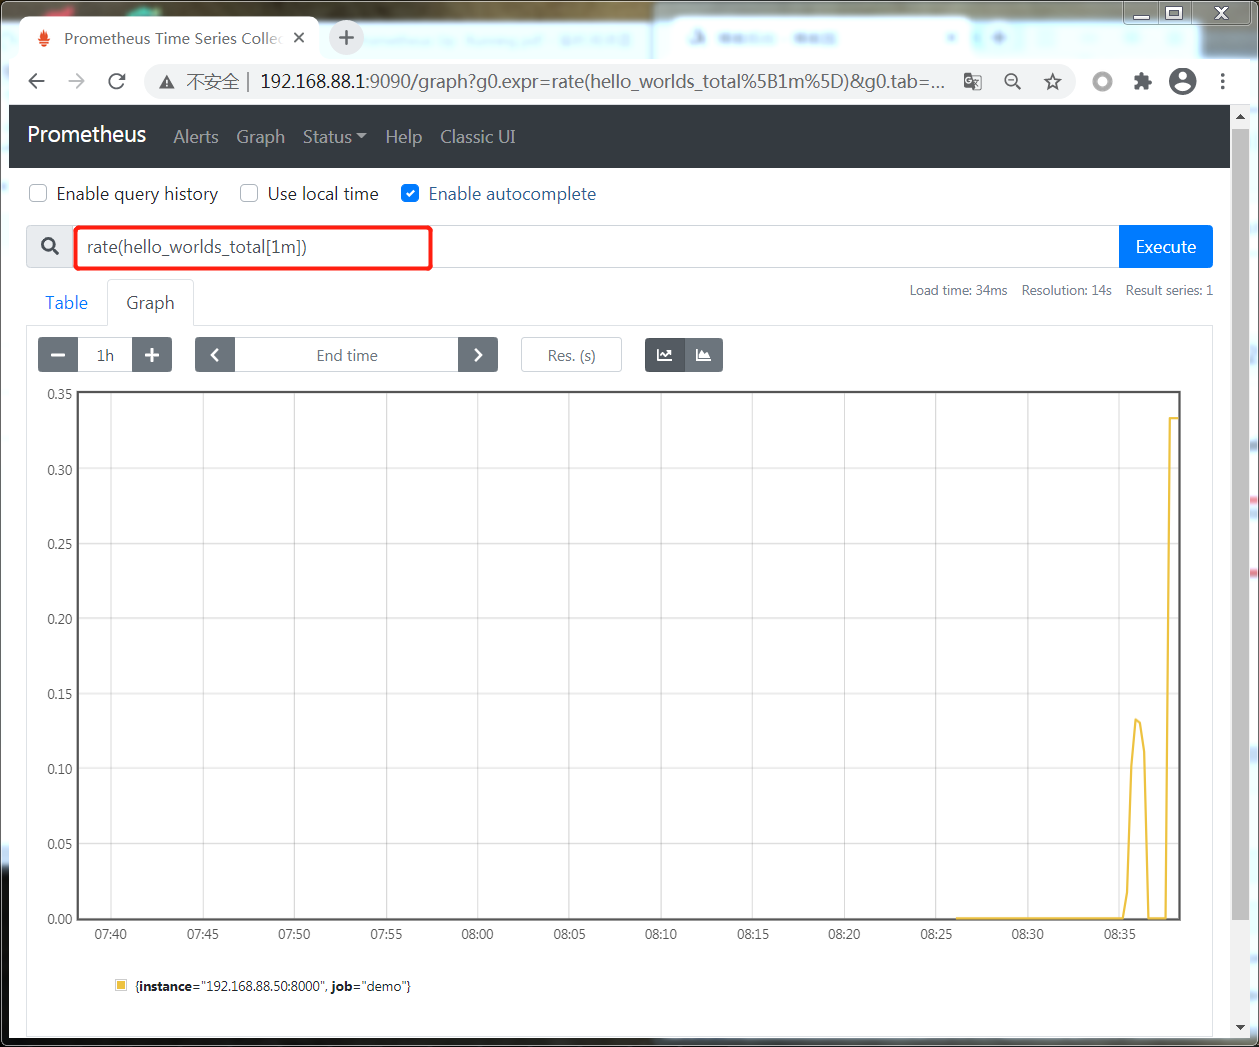
使用PromQL表达式查看 请求的速率
Counting Exceptions
客户端库不仅提供核心功能,还提供了实用的方法。在Python中计算异常我们可以直接利用count_exceptions上下文管理器和装饰器。


import random
from prometheus_client import Counter

REQUESTS = Counter('hello_worlds_total', 'Hello worlds requested.')
EXCEPTIONS = Counter('hello_word_excpetions_total', 'Exceptions serving Hello World.')


class MyHandler(http.server.BaseHTTPRequestHandler):
    def do_GET(self):
        REQUESTS.inc()
     # 这里我们使用随机数才产生异常,通过count_exceptions能够记录发生异常的次数,并且不干扰程序逻辑
        with EXCEPTIONS.count_exceptions():
            if random.random() < 0.2:
                raise Exception
        self.send_response(200)
        self.end_headers()
        self.wfile.write(b"Hello world")
查看异常率 : rate(hello_word_excpetions_total[1m])
查看异常请求比例: rate(hello_word_excpetions_total[1m]) / rate(hello_worlds_total[1m])
我们也可以使用count_exceptions装饰器
import random
from prometheus_client import Counter

REQUESTS = Counter('hello_worlds_total', 'Hello worlds requested.')
EXCEPTIONS = Counter('hello_word_excpetions_total', 'Exceptions serving Hello World.')


class MyHandler(http.server.BaseHTTPRequestHandler):
   #使用装饰器
    @EXCEPTIONS.count_exceptions()
    def do_GET(self):
        REQUESTS.inc()
        if random.random() < 0.2:
            raise Exception
        self.send_response(200)
        self.end_headers()
        self.wfile.write(b"Hello world")
因为Prometheus 使用 64位浮点数作为值,所以计数器不是只能加1,我们可以将计数器加到任何非负数。例如
REQUESTS = Counter('hello_worlds_total', 'Hello worlds requested.')
REQUESTS.inc(2.5)
Gauge
Gauge指标类型反应了当前的状态,它是一个可以上下浮动的实际值。而Counter我们往往关心它的增长速度。
Gauge一些常见的例子如:
- 队列中消息的数量
- 内存使用情况
- 活动线程数
- 最后一次处理记录的时间
- 最后一分钟每秒平均请求数
我们可以使用Gauge提供的3个主要方法: inc、dec、和set。
inc 默认将值追加1, dec默认将值递减1,set可以通过参数将值设置成我们想要的
下面通过案例展示如何使用Gauge来跟踪 正在调用的数量和最后一次调用完成的时间
import time
from prometheus_client import Gauge

INPROGRESS = Gauge('hello_worlds_inprogress', 'Number of Hello Worlds in progress.')
LAST = Gauge('hello_world_last_time_seconds', 'The last time a Hello World was served.')

class MyHandler(http.server.BaseHTTPRequestHandler):
    def do_GET(self):
        # 开始调用,值+1
        INPROGRESS.inc()
        self.send_response(200)
        self.end_headers()
        self.wfile.write(b"Hello World")
        # 记录当前时间戳
        LAST.set(time.time())
        # 调用完成,值-1
        INPROGRESS.dec()
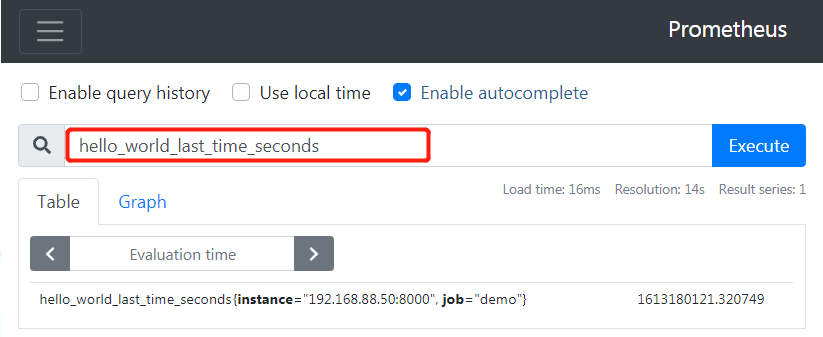
这种Gauge类型的指标,我们是直接在expression browser中使用, 比如: hello_world_last_time_seconds, 确定访问的最后时间
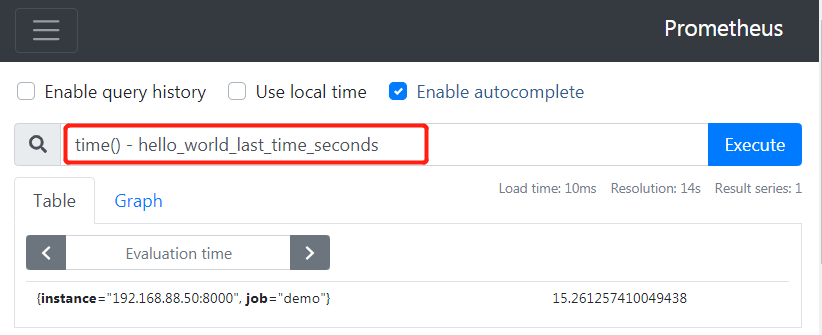
我们也可以通过 time() - hello_world_last_time_seconds来计算出距离最后一次访问过了多少秒
上面的案例都是比较常见的,因此也对他们提供了使用的装饰器函数 : track_inprogress
from prometheus_client import Gauge

INPROGRESS = Gauge('hello_worlds_inprogress', 'Number of Hello Worlds in progress.')
LAST = Gauge('hello_world_last_time_seconds', 'The last time a Hello World was served.')

class MyHandler(http.server.BaseHTTPRequestHandler):
    @INPROGRESS.track_inprogress()
    def do_GET(self):
        self.send_response(200)
        self.end_headers()
        self.wfile.write(b"Hello World")
        # 记录当前时间戳, 可以直接使用set_to_current_time方法
        LAST.set_to_current_time()
通常counter类型的mertic都会加上后缀,如: _total、_count、sum和_bucket等,并且强烈建议加上单位名:如,(counter类型指标)处理的字节数可能会命名为:myapp_requests_processed_bytes_total. 然而guage类型的mertic并没有这些后缀,为了避免混淆,我们也不应该使用后缀
Summary
当我们想要知道程序响应请求花费的时间或延迟时,就可以用到Summary类型的指标了。下面这个案例我们来跟踪程序延迟。
import time
from prometheus_client import Summary

LATENCY = Summary('hello_world_latency_seconds', 'Time for a request Hello World')

class MyHandler(http.server.BaseHTTPRequestHandler):
    def do_GET(self):
        # 记录当前程序开始时间
        start = time.time()
        self.send_response(200)
        self.end_headers()
        self.wfile.write(b"Hello World")
        # 程序运行完成时间-开始时间=花费的时间
        LATENCY.observe(time.time() - start)
当我们查看 /mertics或发现有两个指标
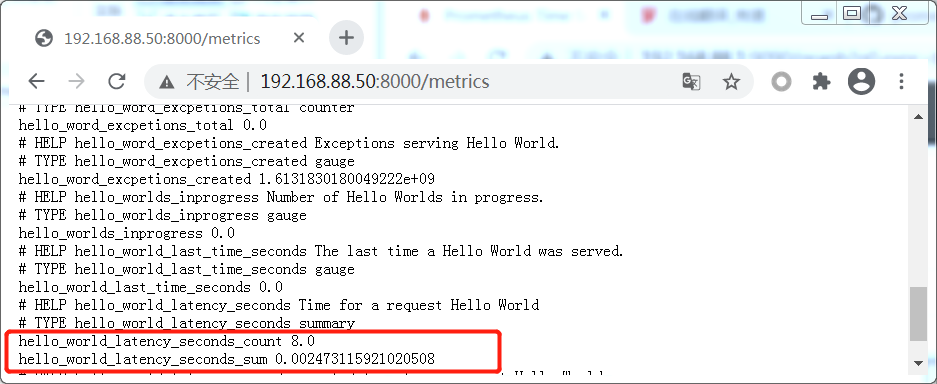
hello_world_latency_seconds_count
记录的是observe调用的次数,因此可以使用表达式: rate(hello_world_latency_seconds_count[1m])返回请求的每秒速率
hello_world_latency_seconds_sum
记录的是传递个observe值得总和,因此可以使用表达式: rate(hello_world_latency_seconds_sum[1m])返回每秒响应请求花费的时间
计算最后一分钟的平均延迟:
rate(hello_world_latency_seconds_sum[1m]) / rate(hello_world_latency_seconds_count[1m])
对于延时监控,我们可以使用装饰器来简化代码
from prometheus_client import Summary

LATENCY = Summary('hello_world_latency_seconds', 'Time for a request Hello World')

class MyHandler(http.server.BaseHTTPRequestHandler):
   #使用装饰器
    @LATENCY.time()
    def do_GET(self):
        self.send_response(200)
        self.end_headers()
        self.wfile.write(b"Hello World")
Histogram
Summary可以提供平均延迟。但如果是分位数(分位数告诉我们某个事件的大小比例低于给定的值),例如:0.95分位数300ms意味着95%的请求花费的时间小于300ms.
分位数在考虑实际的最终用户体验时很有用。如果用户的浏览器向应用程序发出20个并发请求,那么决定用户可见延迟的是请求最慢的一个
案例 :第95百分位数(0.95分位数)捕获延迟
from prometheus_client import Histogram

LATENCY = Histogram('histogram_hello_world_latency_seconds', 'Time for a request Hello World')

class MyHandler(http.server.BaseHTTPRequestHandler):
    @LATENCY.time()
    def do_GET(self):
        self.send_response(200)
        self.end_headers()
        self.wfile.write(b"Hello World")
他将生成一组名为 histogram_hello_word_latency_seconds_bucket的时间序列
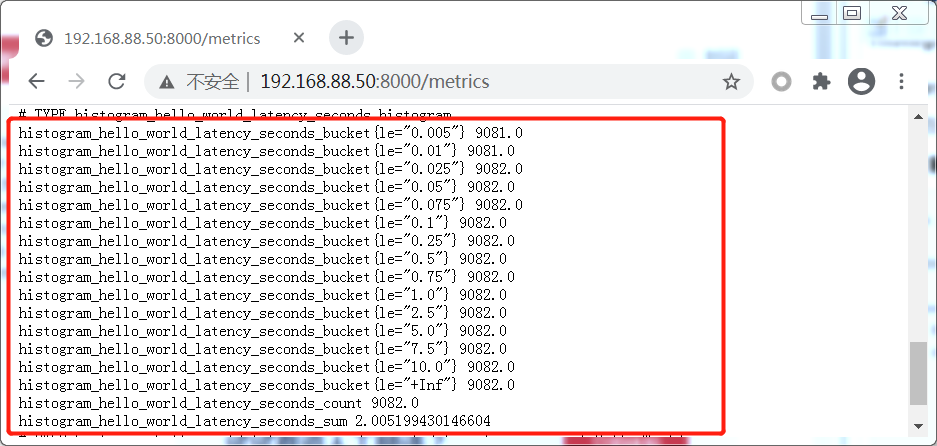
这是一组计数器, 柱状图有一组桶,例如1毫秒、10毫秒和25毫秒,它们跟踪每个桶中的事件数量
现在我们要计算: 95%的访问请求延迟分布在 哪个范围
histogram_quantile(0.95, rate(histogram_hello_world_latency_seconds_bucket[1m]))
Buckets
从图中可以发现默认的buckets延迟范围是0.005秒-10秒, 这是捕获web应用程序的典型延迟范围。如果我们任务默认值不适合自己的用例,我们可以提供自己的buckets, 如下
# buckets里面的值要从小到大, 一般建议配置10个
LATENCY = Histogram('histogram_hello_world_latency_seconds',
                    'Time for a request Hello World',
                    buckets=[0.0001, 0.0002, 0.0005, 0.001, 0.01, 0.1])

观察到每个bucket并不是只属于它自己的事件计数,它包括了比它小的 bukect计数,一直到+Inf(表示事件总数), 这也就是为什么标签是 le(小于或等于)
在分析上图:
+Inf 285 表示一共有285个请求
延迟<=0.0002秒的请求有144个
延迟<=0.001秒的请求有284个
我们也可以准确的计算出请求超过5毫秒(0.005)的请求比例
