1. 首先安装
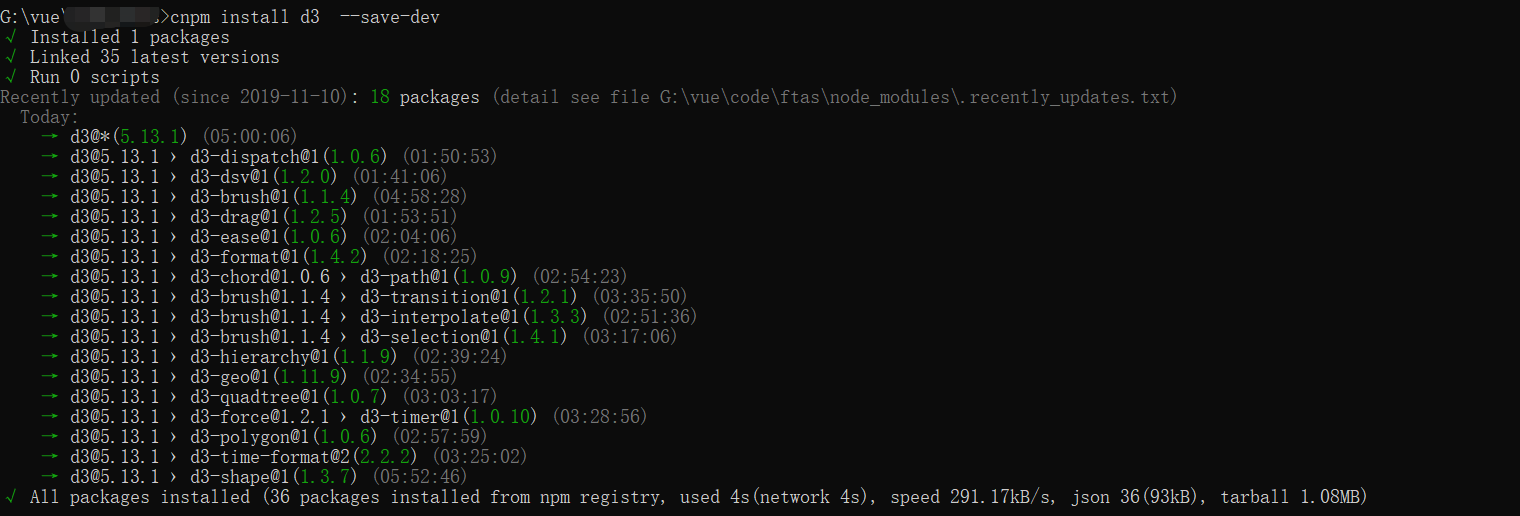
npm install d3 --save-dev
或者
cnpm install d3 --save-dev (需要先安装cnpm,本人喜欢用这个国内镜像比较快)以防万一,然后看package.json
2. 引入:main.js
import * as d3 from "d3";

Vue.prototype.$d3 = d3;
window.d3 = d3;   //暂时设置为全局变量
3. demo代码: demo源码参考地址

<template>
    <div style=" 100%;height: 100%;">
        <svg version="1.1" xmlns="http://www.w3.org/2000/svg" xmlns:xlink="http://www.w3.org/1999/xlink" xml:space="preserve"
         width="960" height="500"> </svg>
    </div>
</template>
<script>
    export default {
        mounted() {
            var svg = d3.select("svg"),
                width = +svg.attr("width"),
                height = +svg.attr("height"),
                color = d3.scaleOrdinal(d3.schemeCategory10);

            var a = {
                    id: "a"
                },
                b = {
                    id: "b"
                },
                c = {
                    id: "c"
                },
                nodes = [a, b, c],
                links = [];

            var simulation = d3.forceSimulation(nodes)
                .force("charge", d3.forceManyBody().strength(-1000))
                .force("link", d3.forceLink(links).distance(200))
                .force("x", d3.forceX())
                .force("y", d3.forceY())
                .alphaTarget(1)
                .on("tick", ticked);

            var g = svg.append("g").attr("transform", "translate(" + width / 2 + "," + height / 2 + ")"),
                link = g.append("g").attr("stroke", "#000").attr("stroke-width", 1.5).selectAll(".link"),
                node = g.append("g").attr("stroke", "#fff").attr("stroke-width", 1.5).selectAll(".node");

            restart();

            d3.timeout(function() {
                links.push({
                    source: a,
                    target: b
                }); // Add a-b.
                links.push({
                    source: b,
                    target: c
                }); // Add b-c.
                links.push({
                    source: c,
                    target: a
                }); // Add c-a.
                restart();
            }, 1000);

            d3.interval(function() {
                nodes.pop(); // Remove c.
                links.pop(); // Remove c-a.
                links.pop(); // Remove b-c.
                restart();
            }, 2000, d3.now());

            d3.interval(function() {
                nodes.push(c); // Re-add c.
                links.push({
                    source: b,
                    target: c
                }); // Re-add b-c.
                links.push({
                    source: c,
                    target: a
                }); // Re-add c-a.
                restart();
            }, 2000, d3.now() + 1000);

            function restart() {

                // Apply the general update pattern to the nodes.
                node = node.data(nodes, function(d) {
                    return d.id;
                });

                node.exit().transition()
                    .attr("r", 0)
                    .remove();

                node = node.enter().append("circle")
                    .attr("fill", function(d) {
                        return color(d.id);
                    })
                    .call(function(node) {
                        node.transition().attr("r", 8);
                    })
                    .merge(node);

                // Apply the general update pattern to the links.
                link = link.data(links, function(d) {
                    return d.source.id + "-" + d.target.id;
                });

                // Keep the exiting links connected to the moving remaining nodes.
                link.exit().transition()
                    .attr("stroke-opacity", 0)
                    .attrTween("x1", function(d) {
                        return function() {
                            return d.source.x;
                        };
                    })
                    .attrTween("x2", function(d) {
                        return function() {
                            return d.target.x;
                        };
                    })
                    .attrTween("y1", function(d) {
                        return function() {
                            return d.source.y;
                        };
                    })
                    .attrTween("y2", function(d) {
                        return function() {
                            return d.target.y;
                        };
                    })
                    .remove();

                link = link.enter().append("line")
                    .call(function(link) {
                        link.transition().attr("stroke-opacity", 1);
                    })
                    .merge(link);

                // Update and restart the simulation.
                simulation.nodes(nodes);
                simulation.force("link").links(links);
                simulation.alpha(1).restart();
            }

            function ticked() {
                node.attr("cx", function(d) {
                        return d.x;
                    })
                    .attr("cy", function(d) {
                        return d.y;
                    })

                link.attr("x1", function(d) {
                        return d.source.x;
                    })
                    .attr("y1", function(d) {
                        return d.source.y;
                    })
                    .attr("x2", function(d) {
                        return d.target.x;
                    })
                    .attr("y2", function(d) {
                        return d.target.y;
                    });
            }
        },
    }
</script>
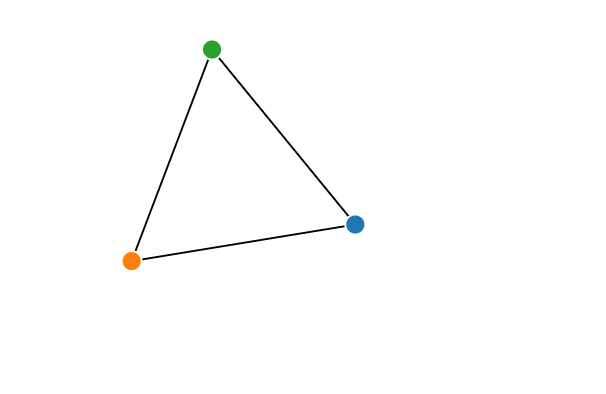
4. demo效果图
案例2: 渲染一个Vue组件,它使用常规的D3 DOM操作呈现一个简单的折线图:
<template>
  <svg width="500" height="270">
    <g style="transform: translate(0, 10px)">
      <path :d="line" />
    </g>
  </svg>
</template>
<script>
import * as d3 from 'd3';
export default {
  name: 'vue-line-chart',
  data() {
    return {
      data: [99, 71, 78, 25, 36, 92],
      line: '',
    };
  },
  mounted() {
    this.calculatePath();
  },
  methods: {
    getScales() {
      const x = d3.scaleTime().range([0, 430]);
      const y = d3.scaleLinear().range([210, 0]);
      d3.axisLeft().scale(x);
      d3.axisBottom().scale(y);
      x.domain(d3.extent(this.data, (d, i) => i));
      y.domain([0, d3.max(this.data, d => d)]);
      return { x, y };
    },
    calculatePath() {
      const scale = this.getScales();
      const path = d3.line()
        .x((d, i) => scale.x(i))
        .y(d => scale.y(d));
      this.line = path(this.data);
    },
  },
};
</script>
<style lang="sass" scoped>
svg
  margin: 25px;
path
  fill: none
  stroke: #76BF8A
  stroke- 3px
</style>非常酷,即使它没有公开任何属性并且数据是硬编码的,它很好地将视图从逻辑中分离出来,并且使用Vue钩子,方法和data对象,现象和上图一样的