若主从同步数据库未同步默认的mysql表,则也需要在从库上创建mysql用户mysqld_exporter用来收集监控数据
mysqld_exporter安装部署
这里采取的是mysqld_exporter安装在mysql主机上
cd /usr/local/src
wget https://github.com/prometheus/mysqld_exporter/releases/download/v0.13.0/mysqld_exporter-0.13.0.linux-amd64.tar.gz
tar -zxv -f mysqld_exporter-0.13.0.linux-amd64.tar.gz -C /usr/local/
cd /usr/local/
mv mysqld_exporter-0.13.0.linux-amd64/ mysqld_exporter
授权连接
这里采取新创建mysql用户的方式
create user 'mysqld_exporter'@'127.0.0.1' identified by '123456'; # 注意,创建的密码除了要符合安全性规则要求外,里面不能包含#,否则会在启动mysqld_exporter时报错连不上mysql,看下面错误提示
GRANT SELECT, PROCESS, SUPER, REPLICATION CLIENT, RELOAD ON *.* TO 'exporter'@'localhost' identified by '123456';
flush privileges;
错误提示:
level=error msg="Error pinging mysqld: Error 1045: Access denied for user 'mysqld_exporter'@'127.0.0.1' (using password: YES)"
创建配置文件,启动服务
vim /usr/local/mysqld_exporter/.my.cnf
[client]
host=127.0.0.1
port=3306
user=mysqld_exporter
password=123456
vim /usr/lib/systemd/system/mysqld_exporter.service

[Unit]
Description=mysqld_exporter
After=network.target

[Service]
Type=simple
ExecStart=/usr/local/mysqld_exporter/mysqld_exporter \
        --collect.info_schema.innodb_tablespaces \
        --collect.info_schema.innodb_metrics  \
        --collect.perf_schema.tableiowaits \
        --collect.perf_schema.indexiowaits \
        --collect.perf_schema.tablelocks \
        --collect.engine_innodb_status \
        --collect.perf_schema.file_events \
        --collect.info_schema.processlist \
        --collect.binlog_size \
        --collect.info_schema.clientstats \
        --collect.perf_schema.eventswaits \
        --collect.global_status \
        --collect.slave_status \
        --config.my-cnf=/usr/local/mysqld_exporter/.my.cnf
Restart=on-failure

[Install]
WantedBy=multi-user.target
systemctl daemon-reload
systemctl start mysqld_exporter
systemctl status mysqld_exporter
ss -tulnp | grep 9104
systemctl enable mysqld_exporter
添加配置到prometheus
vim prometheus.yml

  - job_name: 'mysql-mater-slave'
    scrape_interval: 5s
    static_configs:
    - targets: ['192.168.80.2:9104','192.168.80.3:9104']

systemctl restart prometheus
浏览器访问prometheus
查看状态
Grafana创建模板监控
granafa给 MySQLD_Exporter添加监控图表:
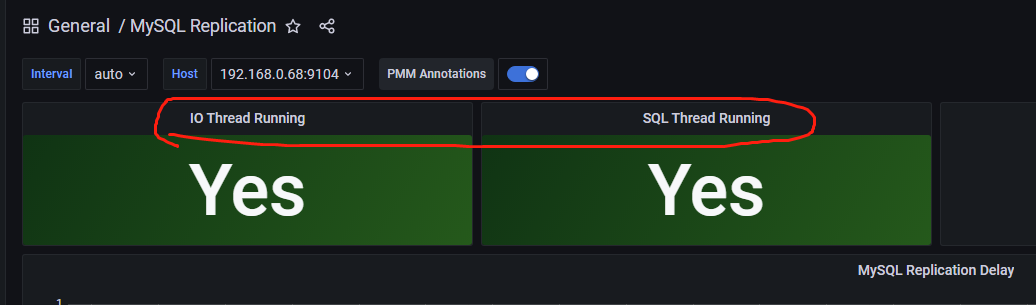
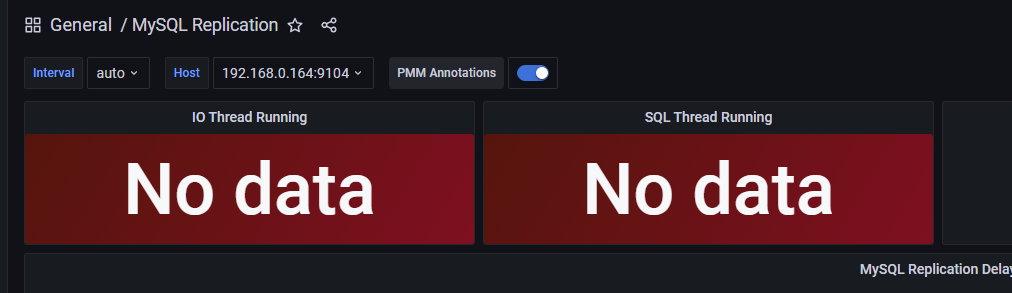
主从集群监控 MySQL Replication:7371
注意,监控的这俩数据值是从库的,因此选择从库是绿色的,选择主库是红色,这是正常的
缓冲池状态 MySQL InnoDB Metrics:7365
相关mysql 状态监控 MySQL Overview:7362