转载自:https://blog.csdn.net/UbuntuTouch/article/details/107127197
在我们今天的练习中,我们将使用 Metricbeat 来同时监控 kibana 及 system 两个模块。在我们的 metricbeat 的安装目录中,我们打入如下的命令:
./metricbeat modules enable system kibana
上面的两个模块 system 及 kibana 都将被启动。我们可以使用如下的命令来检查模块的配置是否成功:
./metricbeat test modules system
./metricbeat test modules kibana
如果你看到正确的信息输出,则表明我们的模块的配置是成功的。否则我们需要修改相应的 yml 文件。
我们接下里进行 setup:
$ ./metricbeat setup
Overwriting ILM policy is disabled. Set `setup.ilm.overwrite:true` for enabling.

Index setup finished.
Loading dashboards (Kibana must be running and reachable)
Loaded dashboards
接下来,我们运行 metricbeat:
./metricbeat -e
我们在 Kibana 的 Discover 界面查看:
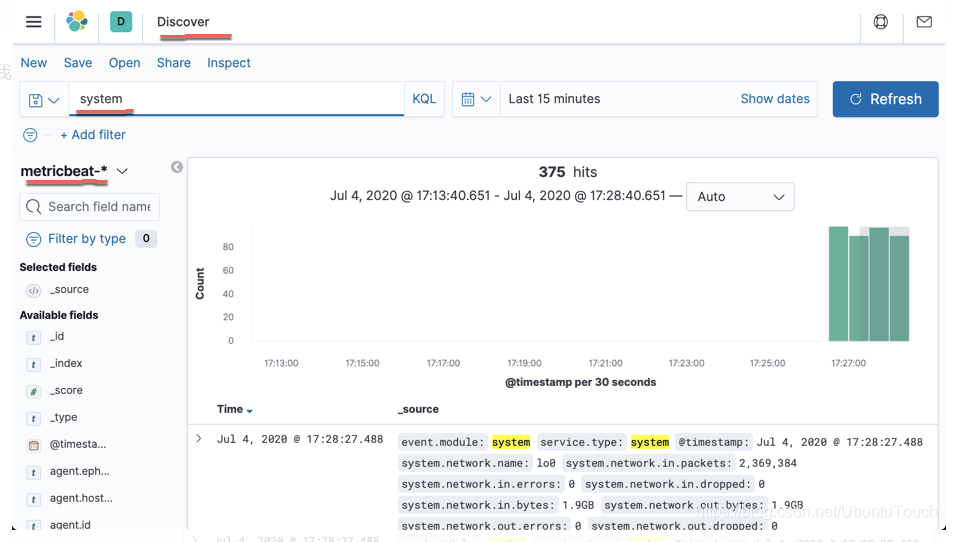
在上面,我们查询 system 时,我们发现 event.module 里含有 system 字样,它表明是一个 system 模块的指标。同时,我们也搜索一下 kibana:
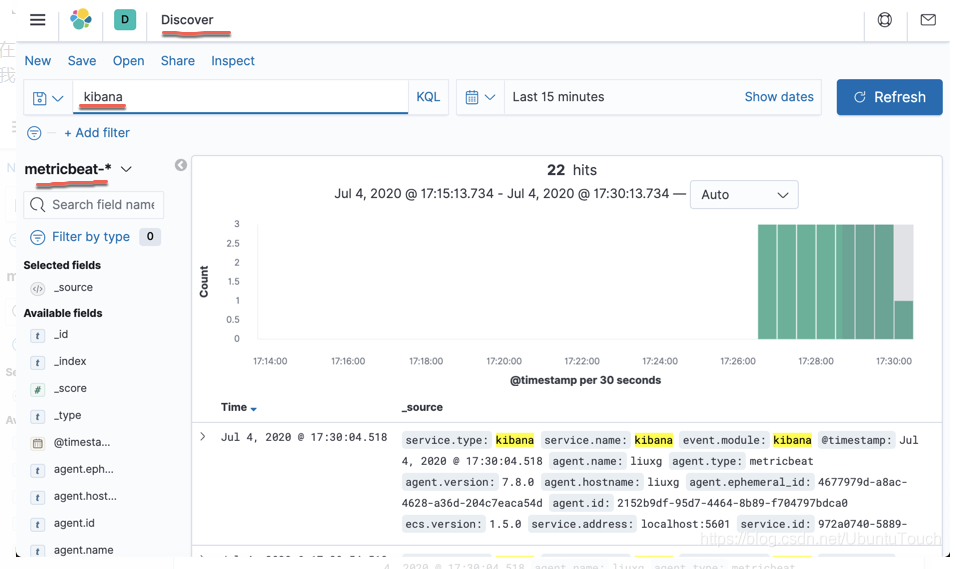
我们可以看到 service.name 及 event.module 都含有 kibana。
现在我们的问题来了:我们想针对这两种不同的模块,分别使用不同的 pipeline 来处理信息,我们该怎么办?
比如,我们针对 kibana 运行如下的 pipeline:
PUT _ingest/pipeline/kibana_pipeline
{
  "processors": [
    {
      "set": {
        "field": "name",
        "value": "kibana"
      }
    }
  ]
}
而对 system 模块运行如下的 pipeline:
    PUT _ingest/pipeline/system_pipeline
    {
      "processors": [
        {
          "set": {
            "field": "name",
            "value": "system"
          }
        }
      ]
    }
虽然,在实际中,我们并不一定要这么做,但是这样的目的是为了展示在不同的情况下运行不同的 pipeline。首先运行上面的两个 pipeline。
为了达到这个目的,我们来修改 metricbeat.yml 文件。首先我们停止 mertricbeat,并删除已有的 metricbeat 文档:
DELETE metricbeat-*
然后修改 metricbeat.yml 文件的 output.elasticsearch 部分:
# ---------------------------- Elasticsearch Output ----------------------------
output.elasticsearch:
  # Array of hosts to connect to.
  hosts: ["localhost:9200"]
  pipelines:
    - pipeline: "system_pipeline"
      when:
        contains:
          event.module: "system"
    - pipeline: "kibana_pipeline"
      when:
        contains:
          event.module: "kibana"
在上面,我们依据 event.module 的内容来判断是否调用 system_pipeline 或者 kibana_pipeline。更多关于条件的介绍,请参阅链接https://www.elastic.co/guide/en/beats/filebeat/current/defining-processors.html#conditions
重新运行我们的 metricbeat:
./metricbeat -e
那么我们会发现一个新的字段叫做 name,并且当 event.module 为了 kibana 时,它的这个值也为 kibana;而当 event.module 的值为 system 时,它的值也为 system。
当然针对我们的情况,我们时间上也可以直接使用如下的方法来实现:
output.elasticsearch:
  # Array of hosts to connect to.
  hosts: ["localhost:9200"]
  pipeline: "%{[event.module]}_pipeline"
在这里,我们使用信息里的一个字段 event.module 来动态地生成相应的 pipeline ID。这个也可以达到同样的目的。