然后我们在用go tool pprof -alloc_space http://127.0.0.1:8080/debug/pprof/heap命令链接程序来查看 内存对象分配的相关情况。然后输入top来查看累积分配内存较多的一些函数调用:
(pprof) top
523.38GB of 650.90GB total (80.41%)
Dropped 342 nodes (cum <= 3.25GB)
Showing top 10 nodes out of 106 (cum >= 28.02GB)
      flat  flat%   sum%        cum   cum%
  147.59GB 22.68% 22.68%   147.59GB 22.68%  runtime.rawstringtmp
  129.23GB 19.85% 42.53%   129.24GB 19.86%  runtime.mapassign
   48.23GB  7.41% 49.94%    48.23GB  7.41%  bytes.makeSlice
   46.25GB  7.11% 57.05%    71.06GB 10.92%  encoding/json.Unmarshal
   31.41GB  4.83% 61.87%   113.86GB 17.49%  net/http.readRequest
   30.55GB  4.69% 66.57%   171.20GB 26.30%  net/http.(*conn).readRequest
   22.95GB  3.53% 70.09%    22.95GB  3.53%  net/url.parse
   22.70GB  3.49% 73.58%    22.70GB  3.49%  runtime.stringtoslicebyte
   22.70GB  3.49% 77.07%    22.70GB  3.49%  runtime.makemap
   21.75GB  3.34% 80.41%    28.02GB  4.31%  context.WithCancel
可以看出string-[]byte相互转换、分配map、bytes.makeSlice、encoding/json.Unmarshal等调用累积分配的内存较多。 此时我们就可以review代码,如何减少这些相关的调用,或者优化相关代码逻辑。
2、
内存使用 内存泄漏
golang 内存分析/动态追踪 — 源代码 https://lrita.github.io/2017/05/26/golang-memory-pprof/
golang pprof
当你的golang程序在运行过程中消耗了超出你理解的内存时,你就需要搞明白,到底是 程序中哪些代码导致了这些内存消耗。此时golang编译好的程序对你来说是个黑盒,该 如何搞清其中的内存使用呢?幸好golang已经内置了一些机制来帮助我们进行分析和追 踪。
此时,通常我们可以采用golang的pprof来帮助我们分析golang进程的内存使用。
pprof 实例
通常我们采用http api来将pprof信息暴露出来以供分析,我们可以采用net/http/pprof 这个package。下面是一个简单的示例:
// pprof 的init函数会将pprof里的一些handler注册到http.DefaultServeMux上
// 当不使用http.DefaultServeMux来提供http api时,可以查阅其init函数,自己注册handler
import _ "net/http/pprof"

go func() {
    http.ListenAndServe("0.0.0.0:8080", nil)
}()
此时我们可以启动进程,然后访问http://localhost:8080/debug/pprof/可以看到一个简单的 页面,页面上显示: 注意: 以下的全部数据,包括go tool pprof 采集到的数据都依赖进程中的pprof采样率,默认512kb进行 一次采样,当我们认为数据不够细致时,可以调节采样率runtime.MemProfileRate,但是采样率越低,进 程运行速度越慢。
/debug/pprof/

profiles:
0         block
136840    goroutine
902       heap
0         mutex
40        threadcreate

full goroutine stack dump
上面简单暴露出了几个内置的Profile统计项。例如有136840个goroutine在运行,点击相关链接 可以看到详细信息。
当我们分析内存相关的问题时,可以点击heap项,进入http://127.0.0.1:8080/debug/pprof/heap?debug=1 可以查看具体的显示:
heap profile: 3190: 77516056 [54762: 612664248] @ heap/1048576
1: 29081600 [1: 29081600] @ 0x89368e 0x894cd9 0x8a5a9d 0x8a9b7c 0x8af578 0x8b4441 0x8b4c6d 0x8b8504 0x8b2bc3 0x45b1c1
#    0x89368d    github.com/syndtr/goleveldb/leveldb/memdb.(*DB).Put+0x59d
#    0x894cd8    xxxxx/storage/internal/memtable.(*MemTable).Set+0x88
#    0x8a5a9c    xxxxx/storage.(*snapshotter).AppendCommitLog+0x1cc
#    0x8a9b7b    xxxxx/storage.(*store).Update+0x26b
#    0x8af577    xxxxx/config.(*config).Update+0xa7
#    0x8b4440    xxxxx/naming.(*naming).update+0x120
#    0x8b4c6c    xxxxx/naming.(*naming).instanceTimeout+0x27c
#    0x8b8503    xxxxx/naming.(*naming).(xxxxx/naming.instanceTimeout)-fm+0x63

......

# runtime.MemStats
# Alloc = 2463648064
# TotalAlloc = 31707239480
# Sys = 4831318840
# Lookups = 2690464
# Mallocs = 274619648
# Frees = 262711312
# HeapAlloc = 2463648064
# HeapSys = 3877830656
# HeapIdle = 854990848
# HeapInuse = 3022839808
# HeapReleased = 0
# HeapObjects = 11908336
# Stack = 655949824 / 655949824
# MSpan = 63329432 / 72040448
# MCache = 38400 / 49152
# BuckHashSys = 1706593
# GCSys = 170819584
# OtherSys = 52922583
# NextGC = 3570699312
# PauseNs = [1052815 217503 208124 233034 1146462 456882 1098525 530706 551702 419372 768322 596273 387826 455807 563621 587849 416204 599143 572823 488681 701731 656358 2476770 12141392 5827253 3508261 1715582 1295487 908563 788435 718700 0 0 0 0 0 0 0 0 0 0 0 0 0 0 0 0 0 0 0 0 0 0 0 0 0 0 0 0 0 0 0 0 0 0 0 0 0 0 0 0 0 0 0 0 0 0 0 0 0 0 0 0 0 0 0 0 0 0 0 0 0 0 0 0 0 0 0 0 0 0 0 0 0 0 0 0 0 0 0 0 0 0 0 0 0 0 0 0 0 0 0 0 0 0 0 0 0 0 0 0 0 0 0 0 0 0 0 0 0 0 0 0 0 0 0 0 0 0 0 0 0 0 0 0 0 0 0 0 0 0 0 0 0 0 0 0 0 0 0 0 0 0 0 0 0 0 0 0 0 0 0 0 0 0 0 0 0 0 0 0 0 0 0 0 0 0 0 0 0 0 0 0 0 0 0 0 0 0 0 0 0 0 0 0 0 0 0 0 0 0 0 0 0 0 0 0 0 0 0 0 0 0 0 0 0 0 0 0 0 0 0 0 0 0 0 0 0 0 0 0 0 0 0 0 0]
# NumGC = 31
# DebugGC = false
其中显示的内容会比较多,但是主体分为2个部分: 第一个部分打印为通过runtime.MemProfile()获取的runtime.MemProfileRecord记录。 其含义为:
heap profile: 3190(inused objects): 77516056(inused bytes) [54762(alloc objects): 612664248(alloc bytes)] @ heap/1048576(2*MemProfileRate)
1: 29081600 [1: 29081600] (前面4个数跟第一行的一样,此行以后是每次记录的,后面的地址是记录中的栈指针)@ 0x89368e 0x894cd9 0x8a5a9d 0x8a9b7c 0x8af578 0x8b4441 0x8b4c6d 0x8b8504 0x8b2bc3 0x45b1c1
#    0x89368d    github.com/syndtr/goleveldb/leveldb/memdb.(*DB).Put+0x59d 栈信息
第二部分就比较好理解,打印的是通过runtime.ReadMemStats()读取的runtime.MemStats信息。 我们可以重点关注一下
Sys进程从系统获得的内存空间,虚拟地址空间。HeapAlloc进程堆内存分配使用的空间,通常是用户new出来的堆对象,包含未被gc掉的。HeapSys进程从系统获得的堆内存,因为golang底层使用TCmalloc机制,会缓存一部分堆内存,虚拟地址空间。PauseNs记录每次gc暂停的时间(纳秒),最多记录256个最新记录。NumGC记录gc发生的次数。
相信,对pprof不了解的用户看了以上内容,很难获得更多的有用信息。因此我们需要引用更多工具来帮助 我们更加简单的解读pprof内容。
go tool
我们可以采用go tool pprof -inuse_space http://127.0.0.1:8080/debug/pprof/heap命令连接到进程中 查看正在使用的一些内存相关信息,此时我们得到一个可以交互的命令行。
我们可以看数据top10来查看正在使用的对象较多的10个函数入口。通常用来检测有没有不符合预期的内存 对象引用。
(pprof) top10
1355.47MB of 1436.26MB total (94.38%)
Dropped 371 nodes (cum <= 7.18MB)
Showing top 10 nodes out of 61 (cum >= 23.50MB)
      flat  flat%   sum%        cum   cum%
  512.96MB 35.71% 35.71%   512.96MB 35.71%  net/http.newBufioWriterSize
  503.93MB 35.09% 70.80%   503.93MB 35.09%  net/http.newBufioReader
  113.04MB  7.87% 78.67%   113.04MB  7.87%  runtime.rawstringtmp
   55.02MB  3.83% 82.50%    55.02MB  3.83%  runtime.malg
   45.01MB  3.13% 85.64%    45.01MB  3.13%  xxxxx/storage.(*Node).clone
   26.50MB  1.85% 87.48%    52.50MB  3.66%  context.WithCancel
   25.50MB  1.78% 89.26%    83.58MB  5.82%  runtime.systemstack
   25.01MB  1.74% 91.00%    58.51MB  4.07%  net/http.readRequest
      25MB  1.74% 92.74%    29.03MB  2.02%  runtime.mapassign
   23.50MB  1.64% 94.38%    23.50MB  1.64%  net/http.(*Server).newConn
然后我们在用go tool pprof -alloc_space http://127.0.0.1:8080/debug/pprof/heap命令链接程序来查看 内存对象分配的相关情况。然后输入top来查看累积分配内存较多的一些函数调用:
(pprof) top
523.38GB of 650.90GB total (80.41%)
Dropped 342 nodes (cum <= 3.25GB)
Showing top 10 nodes out of 106 (cum >= 28.02GB)
      flat  flat%   sum%        cum   cum%
  147.59GB 22.68% 22.68%   147.59GB 22.68%  runtime.rawstringtmp
  129.23GB 19.85% 42.53%   129.24GB 19.86%  runtime.mapassign
   48.23GB  7.41% 49.94%    48.23GB  7.41%  bytes.makeSlice
   46.25GB  7.11% 57.05%    71.06GB 10.92%  encoding/json.Unmarshal
   31.41GB  4.83% 61.87%   113.86GB 17.49%  net/http.readRequest
   30.55GB  4.69% 66.57%   171.20GB 26.30%  net/http.(*conn).readRequest
   22.95GB  3.53% 70.09%    22.95GB  3.53%  net/url.parse
   22.70GB  3.49% 73.58%    22.70GB  3.49%  runtime.stringtoslicebyte
   22.70GB  3.49% 77.07%    22.70GB  3.49%  runtime.makemap
   21.75GB  3.34% 80.41%    28.02GB  4.31%  context.WithCancel
可以看出string-[]byte相互转换、分配map、bytes.makeSlice、encoding/json.Unmarshal等调用累积分配的内存较多。 此时我们就可以review代码,如何减少这些相关的调用,或者优化相关代码逻辑。
当我们不明确这些调用时是被哪些函数引起的时,我们可以输入top -cum来查找,-cum的意思就是,将函数调用关系 中的数据进行累积,比如A函数调用的B函数,则B函数中的内存分配量也会累积到A上面,这样就可以很容易的找出调用链。
(pprof) top20 -cum
322890.40MB of 666518.53MB total (48.44%)
Dropped 342 nodes (cum <= 3332.59MB)
Showing top 20 nodes out of 106 (cum >= 122316.23MB)
      flat  flat%   sum%        cum   cum%
         0     0%     0% 643525.16MB 96.55%  runtime.goexit
 2184.63MB  0.33%  0.33% 620745.26MB 93.13%  net/http.(*conn).serve
         0     0%  0.33% 435300.50MB 65.31%  xxxxx/api/server.(*HTTPServer).ServeHTTP
 5865.22MB  0.88%  1.21% 435300.50MB 65.31%  xxxxx/api/server/router.(*httpRouter).ServeHTTP
         0     0%  1.21% 433121.39MB 64.98%  net/http.serverHandler.ServeHTTP
         0     0%  1.21% 430456.29MB 64.58%  xxxxx/api/server/filter.(*chain).Next
   43.50MB 0.0065%  1.21% 429469.71MB 64.43%  xxxxx/api/server/filter.TransURLTov1
         0     0%  1.21% 346440.39MB 51.98%  xxxxx/api/server/filter.Role30x
31283.56MB  4.69%  5.91% 175309.48MB 26.30%  net/http.(*conn).readRequest
         0     0%  5.91% 153589.85MB 23.04%  github.com/julienschmidt/httprouter.(*Router).ServeHTTP
         0     0%  5.91% 153589.85MB 23.04%  github.com/julienschmidt/httprouter.(*Router).ServeHTTP-fm
         0     0%  5.91% 153540.85MB 23.04%  xxxxx/api/server/router.(*httpRouter).Register.func1
       2MB 0.0003%  5.91% 153117.78MB 22.97%  xxxxx/api/server/filter.Validate
151134.52MB 22.68% 28.58% 151135.02MB 22.68%  runtime.rawstringtmp
         0     0% 28.58% 150714.90MB 22.61%  xxxxx/api/server/router/naming/v1.(*serviceRouter).(git.intra.weibo.com/platform/vintage/api/server/router/naming/v1.service)-fm
         0     0% 28.58% 150714.90MB 22.61%  xxxxx/api/server/router/naming/v1.(*serviceRouter).service
         0     0% 28.58% 141200.76MB 21.18%  net/http.Redirect
132334.96MB 19.85% 48.44% 132342.95MB 19.86%  runtime.mapassign
      42MB 0.0063% 48.44% 125834.16MB 18.88%  xxxxx/api/server/router/naming/v1.heartbeat
         0     0% 48.44% 122316.23MB 18.35%  xxxxxx/config.(*config).Lookup
如上所示,我们就很容易的查找到这些函数是被哪些函数调用的。
根据代码的调用关系,filter.TransURLTov1会调用filter.Role30x,但是他们之间的cum%差值有12.45%,因此 我们可以得知filter.TransURLTov1内部自己直接分配的内存量达到了整个进程分配内存总量的12.45%,这可是一个 值得大大优化的地方。
然后我们可以输入命令web,其会给我们的浏览器弹出一个.svg图片,其会把这些累积关系画成一个拓扑图,提供给 我们。或者直接执行go tool pprof -alloc_space -cum -svg http://127.0.0.1:8080/debug/pprof/heap > heap.svg来生 成heap.svg图片。
下面我们取一个图片中的一个片段进行分析:
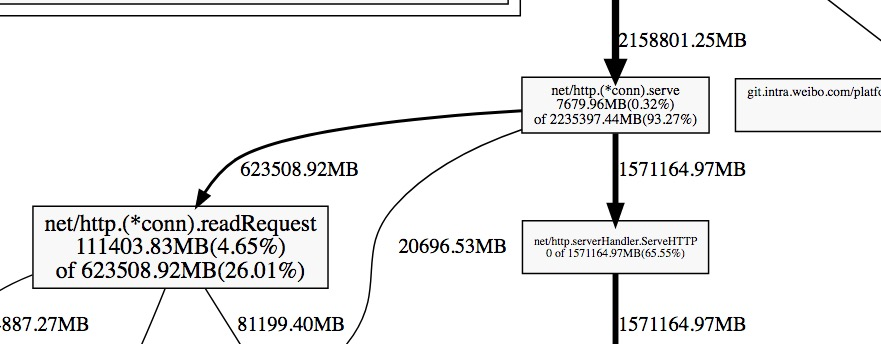
每一个方块为pprof记录的一个函数调用栈,指向方块的箭头上的数字是记录的该栈累积分配的内存向,从方块指出的 箭头上的数字为该函数调用的其他函数累积分配的内存。他们之间的差值可以简单理解为本函数除调用其他函数外,自 身分配的。方块内部的数字也体现了这一点,其数字为:(自身分配的内存 of 该函数累积分配的内存)。
--inuse/alloc_space --inuse/alloc_objects区别
通常情况下:
- 用
--inuse_space来分析程序常驻内存的占用情况; - 用
--alloc_objects来分析内存的临时分配情况,可以提高程序的运行速度。
go-torch
除了直接使用go tool pprof外,我们还可以使用更加直观了火焰图 。因此我们可以直接使用go-torch来生成golang程序的火焰图,该工具也直接 依赖pprof/go tool pprof等。该工具的相关安装请看该项目的介绍。该软件的a4daa2b 以后版本才支持内存的profiling。
我们可以使用
go-torch -alloc_space http://127.0.0.1:8080/debug/pprof/heap --colors=mem
go-torch -inuse_space http://127.0.0.1:8080/debug/pprof/heap --colors=mem
注意:-alloc_space/-inuse_space参数与-u/-b等参数有冲突,使用了-alloc_space/-inuse_space后请将pprof的 资源直接追加在参数后面,而不要使用-u/-b参数去指定,这与go-torch的参数解析问题有关,看过其源码后既能明白。 同时还要注意,分析内存的URL一定是heap结尾的,因为默认路径是profile的,其用来分析cpu相关问题。
通过上面2个命令,我们就可以得到alloc_space/inuse_space含义的2个火焰图,例如 alloc_space.svg/inuse_space.svg。 我们可以使用浏览器观察这2张图,这张图,就像一个山脉的截面图,从下而上是每个函数的调用栈,因此山的高度跟函数 调用的深度正相关,而山的宽度跟使用/分配内存的数量成正比。我们只需要留意那些宽而平的山顶,这些部分通常是我们 需要优化的地方。
testing
当我们需要对go test中某些test/benchmark进行profiling时,我们可以使用类似的方法。例如我们可以先使用go test 内置的参数生成pprof数据,然后借助go tool pprof/go-torch来分析。
- 生成cpu、mem的pprof文件
go test -bench=BenchmarkStorageXXX -cpuprofile cpu.out -memprofile mem.out - 此时会生成一个二进制文件和2个pprof数据文件,例如
storage.test cpu.out mem.out - 然后使用go-torch来分析,二进制文件放前面
#分析cpu
go-torch storage.test cpu.out
#分析内存
go-torch --colors=mem -alloc_space storage.test mem.out
go-torch --colors=mem -inuse_space storage.test mem.out
优化建议
Debugging performance issues in Go programs 提供了一些常用的优化建议:
1 将多个小对象合并成一个大的对象
2 减少不必要的指针间接引用,多使用copy引用
例如使用bytes.Buffer代替*bytes.Buffer,因为使用指针时,会分配2个对象来完成引用。
3 局部变量逃逸时,将其聚合起来
这一点理论跟1相同,核心在于减少object的分配,减少gc的压力。 例如,以下代码
for k, v := range m {
	k, v := k, v   // copy for capturing by the goroutine
	go func() {
		// use k and v
	}()
}
可以修改为:
for k, v := range m {
	x := struct{ k, v string }{k, v}   // copy for capturing by the goroutine
	go func() {
		// use x.k and x.v
	}()
}
修改后,逃逸的对象变为了x,将k,v2个对象减少为1个对象。
4 []byte的预分配
当我们比较清楚的知道[]byte会到底使用多少字节,我们就可以采用一个数组来预分配这段内存。 例如:
type X struct {
    buf      []byte
    bufArray [16]byte // Buf usually does not grow beyond 16 bytes.
}

func MakeX() *X {
    x := &X{}
    // Preinitialize buf with the backing array.
    x.buf = x.bufArray[:0]
    return x
}
5 尽可能使用字节数少的类型
当我们的一些const或者计数字段不需要太大的字节数时,我们通常可以将其声明为int8类型。
6 减少不必要的指针引用
当一个对象不包含任何指针(注意:strings,slices,maps 和chans包含隐含的指针),时,对gc的扫描影响很小。 比如,1GB byte 的slice事实上只包含有限的几个object,不会影响垃圾收集时间。 因此,我们可以尽可能的减少指针的引用。
7 使用sync.Pool来缓存常用的对象
注意
go1.9、go1.9.2之间的版本go tool pprof引入了一个BUG,会导致上面的内存分析命令失败。 下面给出一种修复办法:
cd $GOROOT/src/cmd/vendor/github.com/google
rm pprof
git clone https://github.com/google/pprof.git #确保在版本`e82ee9addc1b6c8e1d667ed6de0194241e1e03b5`之后
rm $GOROOT/pkg/darwin_amd64/cmd/vendor/github.com/google/pprof
cd $GOROOT/src/cmd/pprof
go build
mv pprof $GOROOT/pkg/tool/darwin_amd64/pprof
参考
- profiling-go-programs
- Optimising Go allocations using pprof
- Debugging performance issues in Go programs
- Debugging performance issues in Go programs 翻译(貌似是机器翻译的,语义不是很通顺)
- Golang Slices And The Case Of The Missing Memory
Debugging performance issues in Go* programs https://software.intel.com/content/www/us/en/develop/blogs/debugging-performance-issues-in-go-programs.html
Debug Go Like a Pro. From profiling to debugging and… | by Tyler Finethy | Better Programming | Medium https://medium.com/better-programming/debug-go-like-a-pro-213d4d74e940
From profiling to debugging and everything in between
Once you understand the basics, Golang can make you more productive than ever before. But what do you do when things go wrong?
You may not know this, but Go natively includes pprof for recording and visualizing run-time profiling data. Third-party tools like delve add support for line-by-line debugging. Leak and race detectors can defend against non-deterministic behavior.
If you haven’t seen or used these tools before, they will quickly become powerful additions to your arsenal of Golang tools.
Why Don’t I Just Print Everything?
I’ve met a lot of developers who rarely open the debugger when they run into an issue with their code. I don’t think that’s wrong. If you’re writing unit tests, linting your code, and refactoring along the way, then the quick-and-dirty approach can work for a majority of cases.
Conversely, I’ve been in the throes of troubleshooting problems and realized it’s quicker to pepper in some breakpoints and open an interactive debugger than continually add assertions and print statements.
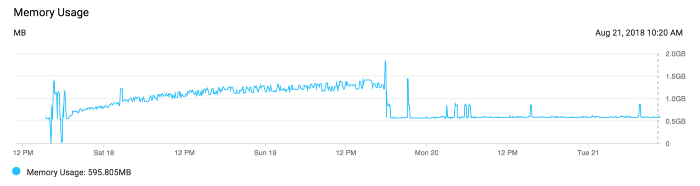
For example, one day I was looking at the memory graph for a web application I helped maintain. Every day the total memory usage slowly increased to the point that the server needed to be restarted to remain stable. This is a classic example of a memory leak.
The quick-and-dirty approach suggests that we read through the code ensuring spawned goroutines exit, allocated variables get garbage collected, connections properly close, etc. Instead, we profiled the application and found the memory leak in a matter of minutes. An elusive, single statement caused it — usually the case for this class of error.
This overview will introduce you to some of the tools I use almost every day to solve problems like this one.
Profiling Recording and Visualization
To get started, let's take a basic Golang web server with a graceful shutdown and send some artificial traffic. Then we’ll use the pprof tool to gather as much information as possible.
// main.go
package main

import (
    "fmt"
    "log"
    "net/http"
    "time"
)
func handler(w http.ResponseWriter, r *http.Request) {
    fmt.Fprintf(w, "Hello World!
")
}

func main() {
    srv := http.Server{
        Addr:         ":8080",
        ReadTimeout:  time.Minute,
        WriteTimeout: time.Minute,
    }
    http.HandleFunc("/", handler)
    done := make(chan os.Signal, 1)
    signal.Notify(done, os.Interrupt, syscall.SIGINT, syscall.SIGTERM)

    go func() {
        srv.ListenAndServe()
    }()
    <-done
    err := srv.Shutdown(context.Background())
    if err != nil {
        log.Fatal(err)
    }
}
We can ensure this works by doing:
$ go run main.go &
$ curl localhost:8080
Hello World!
Now we can profile the CPU by including this snippet:
...
f, err := os.Create("cpu.prof")
if err != nil {
    log.Fatal(err)
}
err = pprof.StartCPUProfile(f)
if err != nil {
    log.Fatal(err)
}
defer pprof.StopCPUProfile()
...
We’ll use a load testing tool to exercise the web server thoroughly to simulate normal to heavy traffic. I used the testing tool vegeta to accomplish this:
$ echo "GET http://localhost:8080" | vegeta attack -duration=5s
Hello world!
...
When we shut down the go web server, we’ll see a file, cpu.prof, that contains the CPU profile. This profile can then be visualized with the pprof tool:
$ go tool pprof cpu.prof
Type: cpu
Time: Jan 16, 2020 at 4:51pm (EST)
Duration: 9.43s, Total samples = 50ms ( 0.53%)
Entering interactive mode (type "help" for commands, "o" for options)
(pprof) top 10
Showing nodes accounting for 50ms, 100% of 50ms total
Showing top 10 nodes out of 24
      flat  flat%   sum%        cum   cum%
      20ms 40.00% 40.00%       20ms 40.00%  syscall.syscall
...
This is good a good start, but Go can do better. We want to profile our application as it receives traffic, that way we don’t have to rely on simulated traffic or add additional code to write profiles to file. Adding the net/http/pprof import will automatically add additional handlers to our web server:
import _ "net/http/pprof"
With that added, we can hit the /debug/pprof/ route through our web browser and see the pprof page teeming with information.
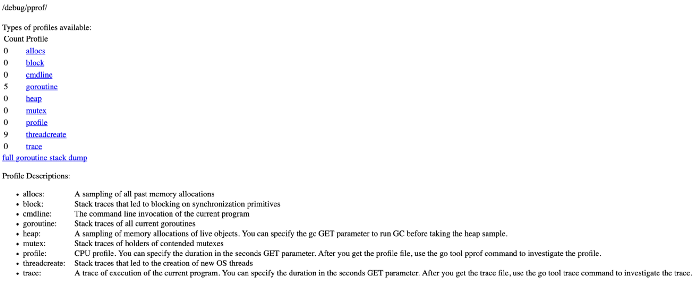
We can get the same information as before by running the command:
$ go tool pprof -top http://localhost:8080/debug/pprof/heap
You can also:
- Generate images based off of the type of profile.
- Create Flame Graphs to visualize the time spent by the application.
- Track Goroutines to detect leaks before they cause degraded service.
Note that for production web servers, we rarely want to avoid exposing this information to the world and should instead bind them to a different internal port.
Delve the Interactive Debugger
Delve is advertised as:
… a simple, full featured debugging tool for Go. Delve should be easy to invoke and easy to use. Chances are if you’re using a debugger, things aren’t going your way. With that in mind, Delve should stay out of your way as much as possible.
To that end, it works really well when you have an issue that’s taking just a little too long to figure out.
Getting started with the tool is fairly easy, just follow the installation steps. Add a runtime.Breakpoint() statement and run your code using dlv:
$ dlv debug main.go
Type 'help' for list of commands.
(dlv) continue
Once you hit the breakpoint you’ll see the block of code, for example in the webserver above I put the it in the handler:
> main.handler() ./main.go:20 (PC: 0x1495476)
    15:         _ "net/http/pprof"
    16: )
    17:
    18: func handler(w http.ResponseWriter, r *http.Request) {
    19:         runtime.Breakpoint()
=>  20:         fmt.Fprintf(w, "Hello World!
")
    21: }
    22:
    23: func main() {
    24:         srv := http.Server{
    25:                 Addr:         ":8080",
(dlv)
Now you can go line by line using the next or n command or dig deeper into a function using the step or s command.
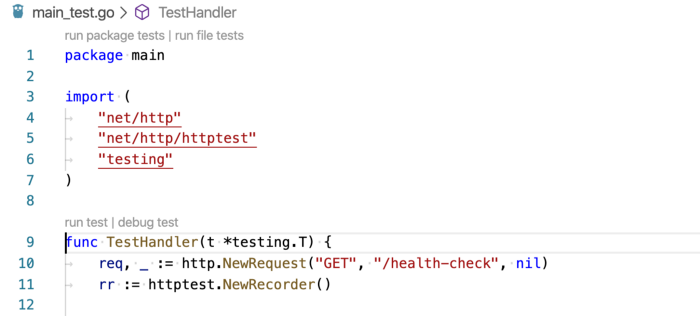
If you’re a fan of a nice UI and clicking buttons instead of using your keyboard, VS Code has great delve support. When writing unit tests using the native testing library, you’ll see a button to debug test which will initialize delve and let you step through the code via VS Code in an interactive session.
For more information on debugging Go code using VS Code check out the Microsoft wiki on it.
Delve can make adding breakpoints, testing assertions, and diving deep into packages a breeze. Don’t be afraid to use it the next time you get stuck on a problem and want to know more about what’s happening.
Leak and Race Detectors
The last topic I’m going to cover is how to add Golang leak and race detectors to your tests. If you haven’t encountered a race condition or experienced a Goroutine memory leak, consider yourself lucky.
In 2017 Uber open-sourced the goleak package, which is a simple tool to check that marks the given TestingT as failed if any extra goroutines are found by Find.
It looks like this:
func TestA(t *testing.T) {
   defer goleak.VerifyNone(t)
   // test logic here.
}
While you’re doing complex asynchronous work, you can ensure that you both avoid regressions and follow the fifth tenet of The Zen of Go:
Before you launch a goroutine,know when it will stop.
Finally, after ensuring you have no Goleaks, you’ll want to protect against race conditions. Thankfully the data race detector is built-in. Consider the example from the race detector’s documentation:
func main() {
	c := make(chan bool)
	m := make(map[string]string)
	go func() {
		m["1"] = "a" // First conflicting access.
		c <- true
	}()
	m["2"] = "b" // Second conflicting access.
	<-c
	for k, v := range m {
		fmt.Println(k, v)
	}
}
This is a data race that can lead to crashes and memory corruption. Running this snippet with the -race flag leads to a panic with a helpful error message:
go run -race main.go
==================
WARNING: DATA RACE
Write at 0x00c0000e2210 by goroutine 8:
  runtime.mapassign_faststr()
      /usr/local/Cellar/go/1.13.6/libexec/src/runtime/map_faststr.go:202 +0x0
  main.main.func1()
      /PATH/main.go:19 +0x5dPrevious write at 0x00c0000e2210 by main goroutine:
  runtime.mapassign_faststr()
      /usr/local/Cellar/go/1.13.6/libexec/src/runtime/map_faststr.go:202 +0x0
  main.main()
      /PATH/main.go:22 +0xc6Goroutine 8 (running) created at:
  main.main()
      /PATH/main.go:18 +0x97
==================
2 b
1 a
Found 1 data race(s)
While you can use the flag during execution of your code, it’s most helpful to add to your go test command to detect races as you write tests.
Conclusion
These are just some of the great tools available in the Golang ecosystem to aid in observing, debugging, and preventing production failures in your codebases. If you’re looking to go further I recommend taking a look at:
- Distributed tracing like Open-tracing Go.
- Time-series monitoring using a tool like Prometheus.
- Structured logging using logrus.
For more information on any of the tools listed above check out the resources section for full documentation and manuals.
func main() {
c := make(chan bool)
m := make(map[string]string)
go func() {
m["1"] = "a" // First conflicting access.
c <- true
}()
m["2"] = "b" // Second conflicting access.
<-c
for k, v := range m {
fmt.Println(k, v)
}
}