http://neuralnetworksanddeeplearning.com/chap1.html
. Sigmoid neurons are similar to perceptrons, but modified so that small changes in their weights and bias cause only a small change in their output.
http://neuralnetworksanddeeplearning.com/chap3.html


// This is a paper.js widget to show a single neuron learning. In
// particular, the widget is used to show the learning slowdown that
// occurs when the output is saturated.
//
// The same basic widget is used several times, in slightly different
// configurations. paper.js makes it somewhat complex to reuse the
// code, so I have simply duplicated the code. This can give rise to
// bugs if one is not careful to keep the code in sync, so I have
// separated the code into two pieces.
//
// The first piece is the header code. This changes between widgets.
// It sets up things like the starting weight, bias, cost function,
// and so on -- things which may vary betweens widgets.
//
// The second piece is the body code. This is almost exactly the same
// for the different widgets. Note, however, that the costGraphX and
// epochX variables change name, due to a bug in the way paperjs
// handles scope.
//
// We can make these changes by searching on costGraph1 and replacing
// with costGraph2, costGraph3 etc, by replacing epoch1 with epoch2,
// epoch3 etc, and by replcacing cost1 with cost2, cost3 etc.
//
// This separation makes it easy to maintain the duplicated code.
// HEADER CODE
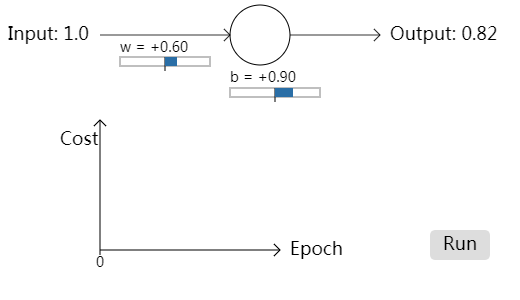
var startingWeight = 0.6;
var startingBias = 0.9;
var eta = 0.15;
var numFrames = 300;
quadratic_cost = {
fn: function(a) {return a*a/2;},
derivative: function(a) {return a*a*(1-a);},
scaling: 240 // used to scale on the graph
}
cross_entropy_cost = {
fn: function(a) {return -Math.log(1-a);},
derivative: function(a) {return 1/(1-a);},
scaling: 30
}
cost1 = quadratic_cost;
// A path for the graph.
costGraph1 = new Path();
costGraph1.strokeColor = "#2A6EA6";
// BODY CODE
// STATIC ELEMENTS
//
// Note that this includes some paper.js items which will later be
// modified, e.g., the variables output and weightText. This section
// merely sets the static parts of the elements.
var input = new PointText(new Point(8, 40));
input.fontSize = 18;
input.content = "Input: 1.0";
arrow(new Point(100, 35), new Point(230, 35), 0.8); // input arrow
var neuron = new Path.Circle(new Point(260, 35), 30);
neuron.strokeColor = "black";
arrow(new Point(290, 35), new Point(380, 35), 0.8); // output arrow
// The output text's content will be set dynamically, later
var output = new PointText(new Point(390, 40));
output.fontSize = 18;
// The weight text and bar
var weightText = new PointText(new Point(120, 52));
weightText.fontSize=14;
var weightBar = new Path.Rectangle(new Rectangle(120, 57, 90, 9));
weightBar.strokeColor = "grey";
weightBar.strokeWidth = 1;
var weightTick = new Path(new Point(165, 57), new Point(165, 71));
weightTick.strokeColor = "black";
var weightSlider = new Path.Line(
new Point(165, 61.5), new Point(165+weight*20, 61.5));
weightSlider.strokeColor = "#2A6EA6";
weightSlider.strokeWidth = 9;
// The bias text and bar
var biasText = new PointText(new Point(230, 82));
biasText.fontSize = 14;
var biasBar = new Path.Rectangle(new Rectangle(230, 88, 90, 9));
biasBar.strokeColor = "grey";
biasBar.strokeWidth = 1;
var biasTick = new Path(new Point(275, 88), new Point(275, 102));
biasTick.strokeColor = "black";
var biasSlider = new Path.Line(
new Point(275, 92.5), new Point(275+bias*20, 92.5));
biasSlider.strokeColor = "#2A6EA6";
biasSlider.strokeWidth = 9;
// Axes for the graph
arrow(new Point(100, 250), new Point(100, 120));
arrow(new Point(100, 250), new Point(130+numFrames/2, 250));
// Labels on the axes
var costText = new PointText(new Point(60, 145));
costText.fontSize = 18;
costText.content = "Cost";
var epoch1LabelText = new PointText(new Point(140+numFrames/2, 255));
epoch1LabelText.fontSize = 18;
epoch1LabelText.content = "Epoch";
// Marker for the current epoch
var epoch1Tick = new Path(new Point(100, 250), new Point(100, 255));
epoch1Tick.strokeColor = "black";
var epoch1Number = new PointText(new Point(100, 267));
epoch1Number.fontSize = 14;
epoch1Number.justification = "center";
// We group the epochTick and epochNumber, to make it easy to move
epoch1 = new Group([epoch1Tick, epoch1Number]);
// Initialize the dynamic elements. It's convenient to do this in a
// function, so that function can also be called upon a (re)start of
// the widget.
var weight, bias;
initDynamicElements();
function initDynamicElements() {
weight = startingWeight;
bias = startingBias;
weightText.content = paramContent("w = ", weight);
weightSlider.segments[1].point.x = 165+weight*20;
biasText.content = paramContent("b = ", bias);
biasSlider.segments[1].point.x = 275+bias*20;
output.content = outputContent(weight, bias);
epoch1.position.x = 100;
epoch1Number.content = "0";
costGraph1.removeSegments();
}
function paramContent(s, x) {
sign = (x >= 0)? "+": "";
return s+sign+x.toFixed(2);
}
// The run button
var runBox = new Path.Rectangle(new Rectangle(430, 230, 60, 30), 5);
runBox.fillColor = "#dddddd";
var runText = new PointText(new Point(460, 250));
runText.justification = "center";
runText.fontSize = 18;
runText.content = "Run";
var runIcon = new Group([runBox, runText]);
runIcon.onMouseEnter = function(event) {
runBox.fillColor = "#aaaaaa";
}
runIcon.onMouseLeave = function(event) {
runBox.fillColor = "#dddddd";
}
var playing = false;
var count = 0;
runIcon.onClick = function(event) {
initDynamicElements();
this.visible = false;
weight = startingWeight;
bias = startingBias;
playing = true;
}
// The actual procedure
function onFrame(event) {
if (playing) {
a = outputValue(weight, bias);
delta = cost1.derivative(a);
weight += -eta*delta;
bias += -eta*delta;
weightText.content = paramContent("w = ", weight);
weightSlider.segments[1].point.x = 165+weight*20;
biasText.content = paramContent("b = ", bias);
biasSlider.segments[1].point.x = 275+bias*20;
output.content = outputContent(weight, bias);
if (count % 2 === 0) {epoch1.position.x += 1;}
costGraph1.add(new Point(epoch1.position.x, 250-cost1.scaling*cost1.fn(a)));
epoch1Number.content = count;
count += 1;
if (count > numFrames) {
count = 0;
runIcon.visible = true;
playing = false;
}
}
}
function outputValue(weight, bias) {
return sigmoid(weight+bias);
}
function outputContent(weight, bias) {
return "Output: "+outputValue(weight, bias).toFixed(2);
}
function sigmoid(z) {
return 1/(1+Math.exp(-z));
}
function arrow(point1, point2, width, color) {
if (typeof width === 'undefined') {width=1};
if (typeof color === 'undefined') {color='black'};
delta = point1 - point2;
n = delta/delta.length;
nperp = new Point(-n.y, n.x);
line = new Path(point1, point2);
line.strokeColor = color;
line.strokeWidth = width;
arrow_stroke_1 = new Path(point2, point2+(n+nperp)*6);
arrow_stroke_1.strokeWidth = width;
arrow_stroke_1.strokeColor = color;
arrow_stroke_2 = new Path(point2, point2+(n-nperp)*6);
arrow_stroke_2.strokeWidth = width;
arrow_stroke_2.strokeColor = color;
}
http://neuralnetworksanddeeplearning.com/js/saturation4.js
// This is a paper.js widget to show a single neuron learning. In
// particular, the widget is used to show the learning slowdown that
// occurs when the output is saturated.
//
// The same basic widget is used several times, in slightly different
// configurations. paper.js makes it somewhat complex to reuse the
// code, so I have simply duplicated the code. This can give rise to
// bugs if one is not careful to keep the code in sync, so I have
// separated the code into two pieces.
//
// The first piece is the header code. This changes between widgets.
// It sets up things like the starting weight, bias, cost function,
// and so on -- things which may vary betweens widgets.
//
// The second piece is the body code. This is almost exactly the same
// for the different widgets. Note, however, that the costGraphX and
// epochX variables change name, due to a bug in the way paperjs
// handles scope.
//
// We can make these changes by searching on costGraph1 and replacing
// with costGraph2, costGraph3 etc, and by replacing epoch1 with
// epoch2, epoch3 etc.
//
// This separation makes it easy to maintain the duplicated code.
// HEADER CODE
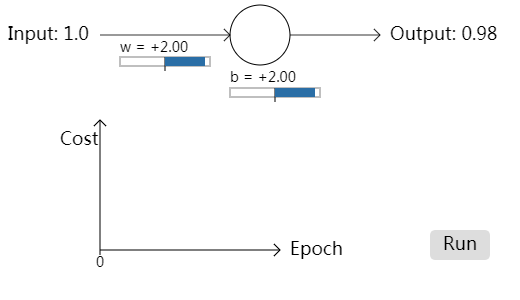
var startingWeight = 2.0;
var startingBias = 2.0;
var eta = 0.005;
var numFrames = 300;
quadratic_cost = {
fn: function(a) {return a*a/2;},
derivative: function(a) {return a*a*(1-a);},
scaling: 240 // used to scale on the graph
}
cross_entropy_cost = {
fn: function(a) {return -Math.log(1-a);},
derivative: function(a) {return 1/(1-a);},
scaling: 30
}
cost4 = cross_entropy_cost;
// A path for the graph.
costGraph4 = new Path();
costGraph4.strokeColor = "#2A6EA6";
// BODY CODE
// STATIC ELEMENTS
//
// Note that this includes some paper.js items which will later be
// modified, e.g., the variables output and weightText. This section
// merely sets the static parts of the elements.
var input = new PointText(new Point(8, 40));
input.fontSize = 18;
input.content = "Input: 1.0";
arrow(new Point(100, 35), new Point(230, 35), 0.8); // input arrow
var neuron = new Path.Circle(new Point(260, 35), 30);
neuron.strokeColor = "black";
arrow(new Point(290, 35), new Point(380, 35), 0.8); // output arrow
// The output text's content will be set dynamically, later
var output = new PointText(new Point(390, 40));
output.fontSize = 18;
// The weight text and bar
var weightText = new PointText(new Point(120, 52));
weightText.fontSize=14;
var weightBar = new Path.Rectangle(new Rectangle(120, 57, 90, 9));
weightBar.strokeColor = "grey";
weightBar.strokeWidth = 1;
var weightTick = new Path(new Point(165, 57), new Point(165, 71));
weightTick.strokeColor = "black";
var weightSlider = new Path.Line(
new Point(165, 61.5), new Point(165+weight*20, 61.5));
weightSlider.strokeColor = "#2A6EA6";
weightSlider.strokeWidth = 9;
// The bias text and bar
var biasText = new PointText(new Point(230, 82));
biasText.fontSize = 14;
var biasBar = new Path.Rectangle(new Rectangle(230, 88, 90, 9));
biasBar.strokeColor = "grey";
biasBar.strokeWidth = 1;
var biasTick = new Path(new Point(275, 88), new Point(275, 102));
biasTick.strokeColor = "black";
var biasSlider = new Path.Line(
new Point(275, 92.5), new Point(275+bias*20, 92.5));
biasSlider.strokeColor = "#2A6EA6";
biasSlider.strokeWidth = 9;
// Axes for the graph
arrow(new Point(100, 250), new Point(100, 120));
arrow(new Point(100, 250), new Point(130+numFrames/2, 250));
// Labels on the axes
var costText = new PointText(new Point(60, 145));
costText.fontSize = 18;
costText.content = "Cost";
var epoch4LabelText = new PointText(new Point(140+numFrames/2, 255));
epoch4LabelText.fontSize = 18;
epoch4LabelText.content = "Epoch";
// Marker for the current epoch
var epoch4Tick = new Path(new Point(100, 250), new Point(100, 255));
epoch4Tick.strokeColor = "black";
var epoch4Number = new PointText(new Point(100, 267));
epoch4Number.fontSize = 14;
epoch4Number.justification = "center";
// We group the epochTick and epochNumber, to make it easy to move
epoch4 = new Group([epoch4Tick, epoch4Number]);
// Initialize the dynamic elements. It's convenient to do this in a
// function, so that function can also be called upon a (re)start of
// the widget.
var weight, bias;
initDynamicElements();
function initDynamicElements() {
weight = startingWeight;
bias = startingBias;
weightText.content = paramContent("w = ", weight);
weightSlider.segments[1].point.x = 165+weight*20;
biasText.content = paramContent("b = ", bias);
biasSlider.segments[1].point.x = 275+bias*20;
output.content = outputContent(weight, bias);
epoch4.position.x = 100;
epoch4Number.content = "0";
costGraph4.removeSegments();
}
function paramContent(s, x) {
sign = (x >= 0)? "+": "";
return s+sign+x.toFixed(2);
}
// The run button
var runBox = new Path.Rectangle(new Rectangle(430, 230, 60, 30), 5);
runBox.fillColor = "#dddddd";
var runText = new PointText(new Point(460, 250));
runText.justification = "center";
runText.fontSize = 18;
runText.content = "Run";
var runIcon = new Group([runBox, runText]);
runIcon.onMouseEnter = function(event) {
runBox.fillColor = "#aaaaaa";
}
runIcon.onMouseLeave = function(event) {
runBox.fillColor = "#dddddd";
}
var playing = false;
var count = 0;
runIcon.onClick = function(event) {
initDynamicElements();
this.visible = false;
weight = startingWeight;
bias = startingBias;
playing = true;
}
// The actual procedure
function onFrame(event) {
if (playing) {
a = outputValue(weight, bias);
delta = cost4.derivative(a);
weight += -eta*delta;
bias += -eta*delta;
weightText.content = paramContent("w = ", weight);
weightSlider.segments[1].point.x = 165+weight*20;
biasText.content = paramContent("b = ", bias);
biasSlider.segments[1].point.x = 275+bias*20;
output.content = outputContent(weight, bias);
if (count % 2 === 0) {epoch4.position.x += 1;}
costGraph4.add(new Point(epoch4.position.x, 250-cost4.scaling*cost4.fn(a)));
epoch4Number.content = count;
count += 1;
if (count > numFrames) {
count = 0;
runIcon.visible = true;
playing = false;
}
}
}
function outputValue(weight, bias) {
return sigmoid(weight+bias);
}
function outputContent(weight, bias) {
return "Output: "+outputValue(weight, bias).toFixed(2);
}
function sigmoid(z) {
return 1/(1+Math.exp(-z));
}
function arrow(point1, point2, width, color) {
if (typeof width === 'undefined') {width=1};
if (typeof color === 'undefined') {color='black'};
delta = point1 - point2;
n = delta/delta.length;
nperp = new Point(-n.y, n.x);
line = new Path(point1, point2);
line.strokeColor = color;
line.strokeWidth = width;
arrow_stroke_1 = new Path(point2, point2+(n+nperp)*6);
arrow_stroke_1.strokeWidth = width;
arrow_stroke_1.strokeColor = color;
arrow_stroke_2 = new Path(point2, point2+(n-nperp)*6);
arrow_stroke_2.strokeWidth = width;
arrow_stroke_2.strokeColor = color;
}