一、决策树ID3递归算法的实现
import numpy as np

class DecisionTree:
    class Node:
        def __init__(self):
            self.value = None

            # 内部叶节点属性
            self.feature_index = None
            self.children = {}

        def __str__(self):
            if self.children:
                s = '内部节点<%s>:
' % self.feature_index
                for fv, node in self.children.items():
                    ss = '[%s]-> %s' % (fv, node)
                    s += '	' + ss.replace('
', '
	') + '
'
                s = s[:-1]
            else:
                s = '叶节点(%s)' % self.value
            return s

    def __init__(self, gain_threshold=1e-2):
        # 信息增益阈值
        self.gain_threshold = gain_threshold

    def _entropy(self, y):
        # 熵: -sum(pi*log(pi))
        c = np.bincount(y)
        p = c[np.nonzero(c)] / y.size
        return -np.sum(p * np.log2(p))

    def _conditional_entropy(self, feature, y):
        # 条件熵
        feature_values = np.unique(feature)
        h = 0.
        for v in feature_values:
            y_sub = y[feature == v]
            p = y_sub.size / y.size
            h +=  p * self._entropy(y_sub)
        return h

    def _information_gain(self, feature, y):
        # 信息增益 = 经验熵 - 经验条件熵
        return self._entropy(y) - self._conditional_entropy(feature, y)

    def _select_feature(self, X, y, features_list):
        # 选择信息增益最大特征

        # 正常情况下, 返回特征(最大信息增益)在features_list中的index值.
        if features_list:
            gains = np.apply_along_axis(self._information_gain, 0, X[:, features_list], y)
            index = np.argmax(gains)
            if gains[index] > self.gain_threshold:
                return index

        # 当features_list已为空, 或所有特征信息增益都小于阈值, 返回None.
        return None

    def _create_tree(self, X, y, features_list):
        # 创建节点
        node = DecisionTree.Node()
        # 统计数据集中样本类标记的个数
        labels_count = np.bincount(y)
        # 任何情况下, 节点值总等于数据集中样本最多的类标记.
        node.value = np.argmax(np.bincount(y))

        # 判断类标记是否全部一致
        if np.count_nonzero(labels_count) != 1:
            # 选择信息增益最大的特征
            index = self._select_feature(X, y, features_list)

            # 能选择到适合的特征时, 创建内部节点, 否则创建叶节点.
            if index is not None:
                # 将已选特征从特征集合中删除.
                node.feature_index = features_list.pop(index)

                # 根据已选特征的取值划分数据集, 并使用数据子集创建子树.
                feature_values = np.unique(X[:, node.feature_index])
                for v in feature_values:
                    # 筛选出数据子集
                    idx = X[:, node.feature_index] == v
                    X_sub, y_sub = X[idx], y[idx]
                    # 创建子树
                    node.children[v] = self._create_tree(X_sub, y_sub, features_list.copy())

        return node

    def _predict_one(self, x_test):
        # 搜索决策树, 对单个样本进行预测.

        # 爬树一直爬到某叶节点为止, 返回叶节点的值.
        node = self.tree_
        while node.children:
            child = node.children.get(x_test[node.feature_index])
            if not child:
                # 根据测试点属性值不能找到相应子树(这是有可能的),
                # 则停止搜索, 将该内部节点当作叶节点(返回其值).
                break
            node = child

        return node.value

    def train(self, X_train, y_train):
        # 训练决策树
        _, n = X_train.shape
        self.tree_ = self._create_tree(X_train, y_train, list(range(n)))

    def predict(self, X_test):
        # 对每一个测试样本, 调用_predict_one, 将收集到的结果数组返回.
        return np.apply_along_axis(self._predict_one, axis=1, arr=X_test)

    def __str__(self):
        if hasattr(self, 'tree_'):
            return str(self.tree_)
        return ''
二、数据集的加载
数据集获取的网站
http://archive.ics.uci.edu/ml/machine-learning-databases/lenses/
数据描述信息:
1. Title: Database for fitting contact lenses
2. Sources:
(a) Cendrowska, J. "PRISM: An algorithm for inducing modular rules",
International Journal of Man-Machine Studies, 1987, 27, 349-370
(b) Donor: Benoit Julien (Julien@ce.cmu.edu)
(c) Date: 1 August 1990
3. Past Usage:
1. See above.
2. Witten, I. H. & MacDonald, B. A. (1988). Using concept
learning for knowledge acquisition. International Journal of
Man-Machine Studies, 27, (pp. 349-370).
Notes: This database is complete (all possible combinations of
attribute-value pairs are represented).
Each instance is complete and correct.
9 rules cover the training set.
4. Relevant Information Paragraph:
The examples are complete and noise free.
The examples highly simplified the problem. The attributes do not
fully describe all the factors affecting the decision as to which type,
if any, to fit.
5. Number of Instances: 24
6. Number of Attributes: 4 (all nominal)
7. Attribute Information:
-- 3 Classes
1 : the patient should be fitted with hard contact lenses,
2 : the patient should be fitted with soft contact lenses,
3 : the patient should not be fitted with contact lenses.
1. age of the patient: (1) young, (2) pre-presbyopic, (3) presbyopic
2. spectacle prescription: (1) myope, (2) hypermetrope
3. astigmatic: (1) no, (2) yes
4. tear production rate: (1) reduced, (2) normal
8. Number of Missing Attribute Values: 0
9. Class Distribution:
1. hard contact lenses: 4
2. soft contact lenses: 5
3. no contact lenses: 15
加载
import numpy as np
dataset=np.genfromtxt('F:/python_test/data/lenses.data')
print(dataset)
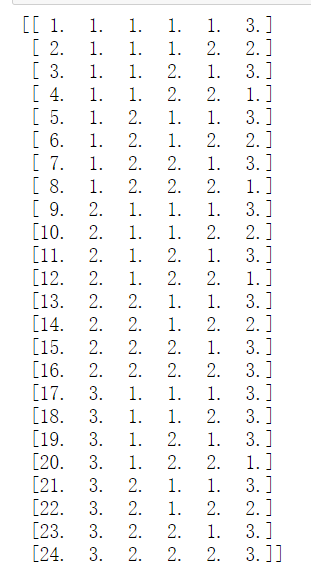
除去样本的id,将属性和决策结果分开并训练模型
X=dataset[:,1:-1]
y=dataset[:,-1]
y=y.astype('int64')
X=X.astype('int64')
dt=DecisionTree()
dt.train(X,y)
三、打印树的结构
规模小的时候可以通过上述代码中的函数打印树的结构
print(dt)
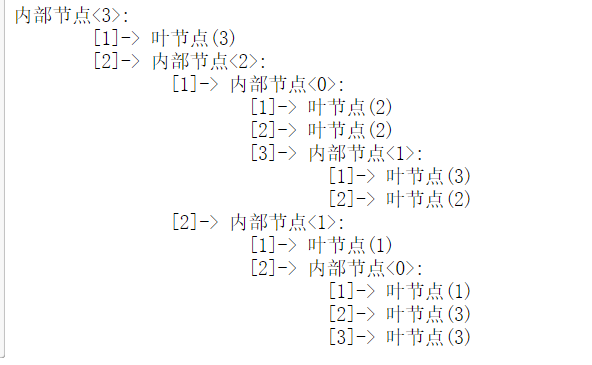
其中内部节点<>表示的是属性的下标,上述描述文件中的下标是从1开始的,在这里的下标是0-3
叶节点的值()表示的是类别标记,一共有1,2,3三种
下标[]表示的是属性的下标,对应于每一个内部节点都有一些属性划分,缩进表示的是以这个结点为根,一下都是他的子节点
下面我们通过另一种方式展示决策树,通过graphviz,下载可以通过网上搜索,官网比较慢,建议直接下载网页上的快速下载就行,将bin文件加入环境变量,并且在命令行中输入dot -version查看是否设置成功,成功之后便可以通过下面的程序以上述已经测试好的树来进行可视化。首先写可视化代码:
from graphviz import Digraph
class DecisionTreePlotter:
    def __init__(self,tree,feature_names=None,label_names=None):
        #保存决策树
        self.tree=tree
        self.feature_names=feature_names
        self.label_names=label_names
        self.graph=Digraph('Decision Tree')

    def _build(self,dt_node):

        if dt_node.children:
            #dt_node是内部节点

            #获取特征名字
            d=self.feature_names[dt_node.feature_index]
            if self.feature_names:
                label=d['name']
            else:
                label=str(dt_node.feature_index)

            #创建方形内部节点graphviz
            self.graph.node(str(id(dt_node)),label=label,shape='box')

            for feature_value,dt_child in dt_node.children.items():
                #递归调用build构建子节点graphviz
                child=self._build(dt_child)

                #获得特征值的名9字
                d_value=d.get('value_names')
                if d_value:
                    label=d_value[feature_value]
                else:
                    label=str(feature_value)

                #创建连接父子节点的边(graphviz)
                self.graph.edge(str(id(dt_node)),str(id(dt_child)),label=label,font_size='10')
        else:
            #dt_node是叶节点

            #获取类标记的名字
            if self.label_names:
                label=self.label_names[dt_node.value]
            else:
                label=str(node.value)

            #创建圆形叶子结点(graphviz)
            self.graph.node(str(id(dt_node)),label=label,shape='')

    def plot(self):
        #创建graphviz图
        self._build(self.tree)
        #显示图
        self.graph.view()
为属性和决策的取值设置映射,这是按照属性的录入顺序设置的,下标要从0开始,然后分类标记不需要从0开始
import numpy as np
D=np.genfromtxt('F:/python_test/data/lenses.data')
X=D[:,1:-1]
y=D[:,-1]
X=X.astype('int64')
y=y.astype('int64')
dt=DecisionTree()
dt.train(X,y)

feature_dict = {
    0:{
        'name':'age',
        'value_names':{1:'young',2:'pre-presbyopic',3:'presbyopic'}
    },

    1:{
       'name':'prescript',
        'value_names':{1:'myope',2:'hypermetrope'}
    },

    2:{
        'name':'astigmatic',
        'value_names':{1:'no',2:'yes'}
    },

    3:{
        'name':'tear rate',
        'value_names':{1:'reduced',2:'normal'}
    },
}

label_dict = {
    1:'hard',
    2:'soft',
    3:'no_lenses',
}

dtp=DecisionTreePlotter(dt.tree_,feature_names=feature_dict,label_names=label_dict)
dtp.plot()
决策树生成之后是一个pdf+gv文件,我们可以将gv文件用graphviz/bin/gvedit.exe打开并且保存为png,最终决策树生成的结果如下图所示
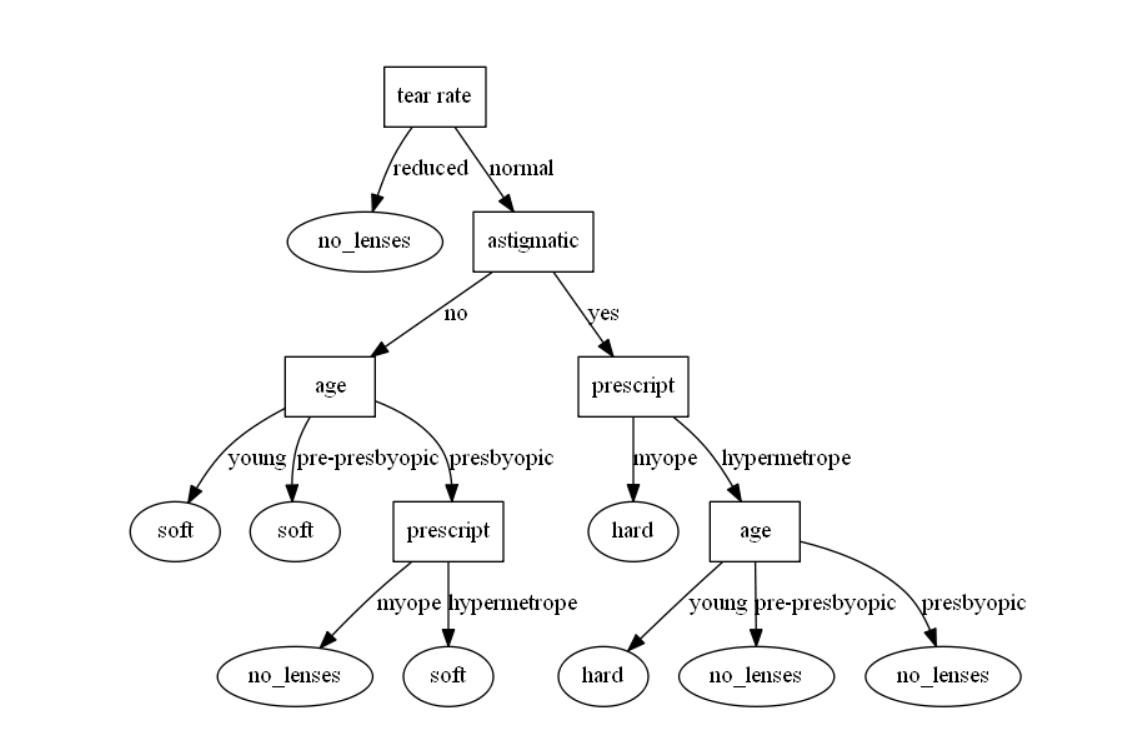
我们在做决策的时候,只需要按照属性以及取值进行匹配即可到达一个叶节点,做出决策,ID3算法是一个简洁高效的算法
四、项目实战
4.1 数据集的获取 car.data
http://archive.ics.uci.edu/ml/machine-learning-databases/car/
4.2 查看数据
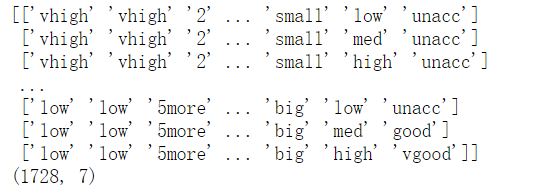
import numpy as np
dataset=np.genfromtxt('F:/python_test/data/car.data',delimiter=',',dtype=np.str)
print(dataset)
print(dataset.shape)
4.3 标签转换成整型
from sklearn.preprocessing import LabelEncoder
le=LabelEncoder()
col=dataset[:,0]
print('第一列的原始数据:
',col)
le.fit(col)
print('第一列转换之后的数据:
',le.transform(col))
print('第一列标签的保存:
',le.classes_)

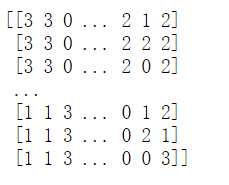
4.4 对每一列数据进行转换
#对每一列进行转换
def convert(col,value_name_list):
    le=LabelEncoder()
    res=le.fit_transform(col)
    value_name_list.append(le.classes_)
    return res

value_name_list=[]
dataset=np.apply_along_axis(convert,axis=0,arr=dataset,value_name_list=value_name_list)
print(dataset)
print(value_name_list)

4.5 数据集加载、划分以及属性集、标签集的映射
X=dataset[:,:-1]
y=dataset[:,-1]
from sklearn.model_selection import train_test_split
X_train,X_test,y_train,y_test = train_test_split(X,y,test_size=0.3)
dt=DecisionTree()
dt.train(X_train,y_train)
feature_names = ['buying','maint','doors','persons','lug_boot','safety']

#使用保存的属性名称对整数的属性进行赋值
feature_dict={
    i:{
        'name':v,
        'value_names':dict(enumerate(value_name_list[i]))
    }for i,v in enumerate(feature_names)
}

#value_name_list中的最后一列数据是类别标记
label_dict = dict(enumerate(value_name_list[-1]))

plotter=DecisionTreePlotter(dt.tree_,feature_names=feature_dict,label_names=label_dict)
plotter.plot()
构成的决策树如下图所示,是一棵枝叶很茂盛的树

4.6 计算在测试集大小不同的情况下模型的泛化能力
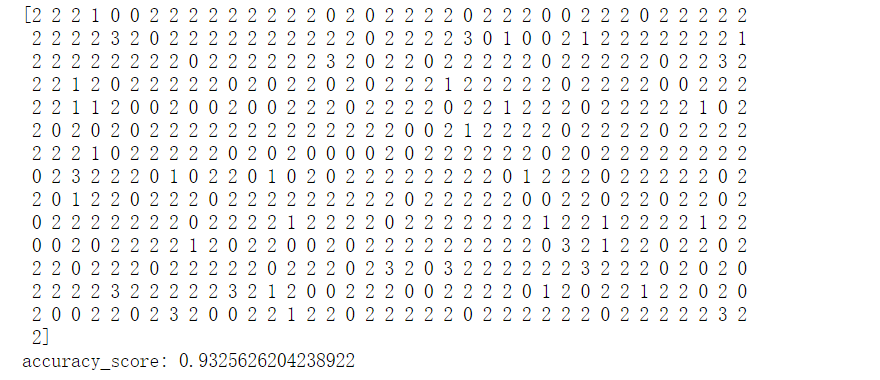
单次测试得到模型的准确度为0.93
from sklearn.metrics import accuracy_score
y_predict=dt.predict(X_test)
print(y_predict)
score=accuracy_score(y_test,y_predict)
print('accuracy_score:',score)
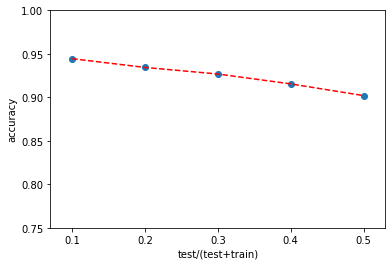
观察不同的测试集大小划分情况下的准确度,以0.1为步长,每个划分大小都测试100次并计算平均准确度
训练集的比例分别是(0.9,0.8,0.7,0.6,0.5)
def test(test_size,times):
    def test_one():
        X_train,X_test,y_train,y_test=train_test_split(X,y,test_size=test_size)
        dt=DecisionTree()
        dt.train(X_train,y_train)
        y_predict = dt.predict(X_test)
        score = accuracy_score(y_test,y_predict)
        return score
    return np.mean([test_one() for _ in range(times)])

TEST_SIZE=np.arange(0.1,0.51,0.1)
SCORE=np.array([test(test_size,100) for test_size in TEST_SIZE])
print(SCORE)

绘制准确度变化曲线
可见即使是50%的测试集和50%的训练集,精确度仍然达到了90%,略有下降
import matplotlib.pyplot as plt
plt.scatter(TEST_SIZE,SCORE)
plt.plot(TEST_SIZE,SCORE,'--',color='red')
plt.ylim([0.75,1.0])
plt.xlabel('test/(test+train)')
plt.ylabel('accuracy')
plt.show()
