1 Flink 的配置:
在flink配置⽂件flink-conf.yaml中添加:
metrics.reporter.promgateway.class:
org.apache.flink.metrics.prometheus.PrometheusPushGatewayReporter
metrics.reporter.promgateway.host: localhost # promgateway 主要是Pushgateway所在机器的ip地址
metrics.reporter.promgateway.port: 9091
metrics.reporter.promgateway.jobName: zhisheng // 随意起名
metrics.reporter.promgateway.randomJobNameSuffix: true
metrics.reporter.promgateway.deleteOnShutdown: false
将flink包中opt文件下的flink-metrics-prometheus-xxxxx.jar包复制到lib文件夹中
2 pushgateway 配置
2.1 下载prometheus到window上
Prometheus 的下载链接为:
https://prometheus.io/download/
下载 pushgateway-1.3.0.windows-amd64.tar.gz 后解压
3 Prometheus配置
3.1 下载prometheus到window上
Prometheus 的下载链接为:
https://prometheus.io/download/
下载 prometheus-2.22.0.windows-amd64.tar.gz 后解压
这里所需Prometheus的组件为:
- prometheus
- pushgateway(Flink推送监控数据到此)
将这些组件分别解压到任意目录。
3.2 配置Prometheus
修改Prometheus根目录prometheus.yml文件的scrape_config,如下图所示:
# my global config
global:
  scrape_interval:     15s # Set the scrape interval to every 15 seconds. Default is every 1 minute.
  evaluation_interval: 15s # Evaluate rules every 15 seconds. The default is every 1 minute.
  # scrape_timeout is set to the global default (10s).

# Alertmanager configuration
alerting:
  alertmanagers:
  - static_configs:
    - targets:
      # - alertmanager:9093

# Load rules once and periodically evaluate them according to the global 'evaluation_interval'.
rule_files:
  # - "first_rules.yml"
  # - "second_rules.yml"

# A scrape configuration containing exactly one endpoint to scrape:
# Here it's Prometheus itself.
scrape_configs:
  # The job name is added as a label `job=<job_name>` to any timeseries scraped from this config.
  - job_name: 'prometheus'
    honor_labels: true

    # metrics_path defaults to '/metrics'
    # scheme defaults to 'http'.

    static_configs:
    - targets: ['localhost:9091']
      labels:
         instance: pushgateway
因为prometheus配置pushgateway 的时候,也会指定job和instance,但是它只表示 pushgateway实例,不能真正表达收集数据的含义。所以配置pushgateway需要添加 honor_labels:true,避免收集数据本身的job和instance被覆盖。
4 Grafana 配置
4.1 下载并启动Grafana
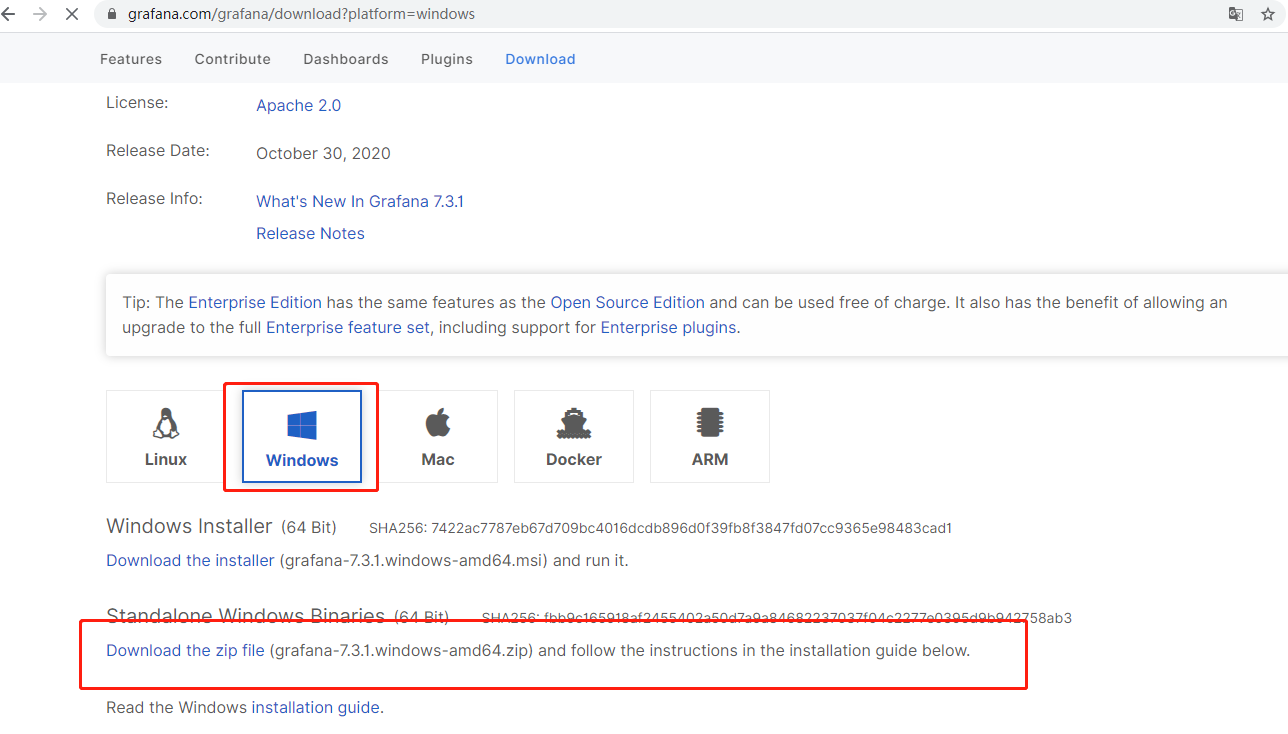
下载Grafana解压,添加prometheus数据源。
Grafana的下载地址为: https://grafana.com/grafana/download
5 启动
5.1 先启动 Pushgateway
通过cmd启动 pushgateway.exe
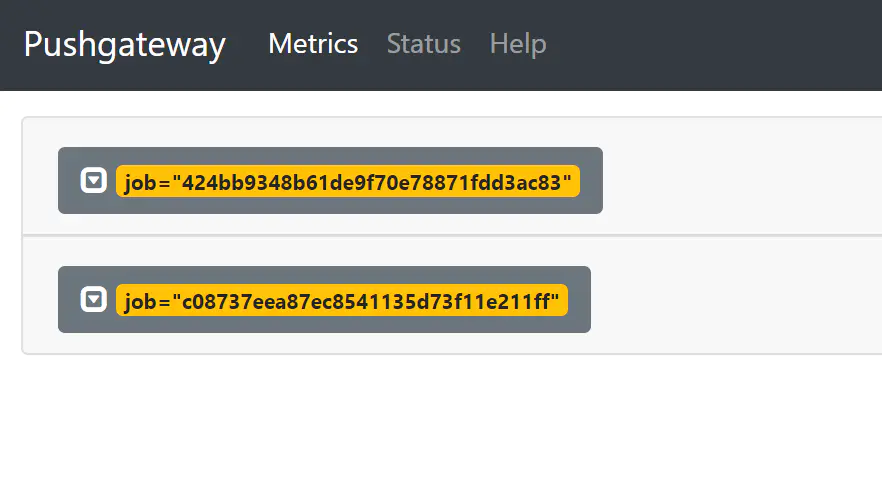
查看metrics:
访问对应组件的URL,例如http://10.180.210.172:9091/metrics(初次安装这里为空白)
5.2 再启动 Prometheus
通过cmd启动prometheus.exe
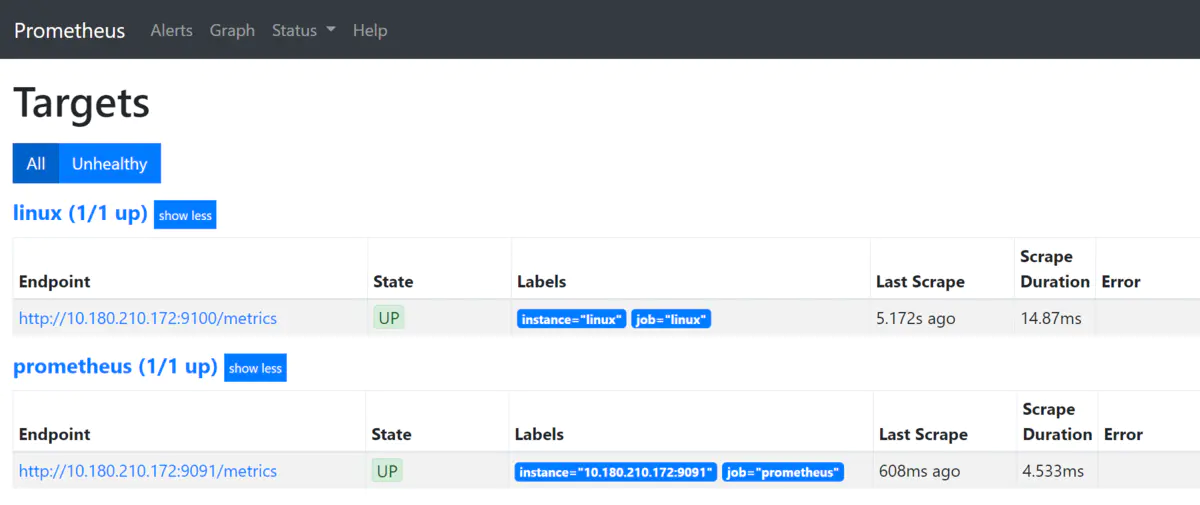
查看各个endpoint是否成功注册在prometheus:
访问prometheus首页(9090端口),打开status -> targets,观察各个endpoint的status是否为UP。
5.3 启动flink
5.4 启动Grafana
通过cmd启动grafana-server.exe

5.4.2 配置Grafana
配置数据源
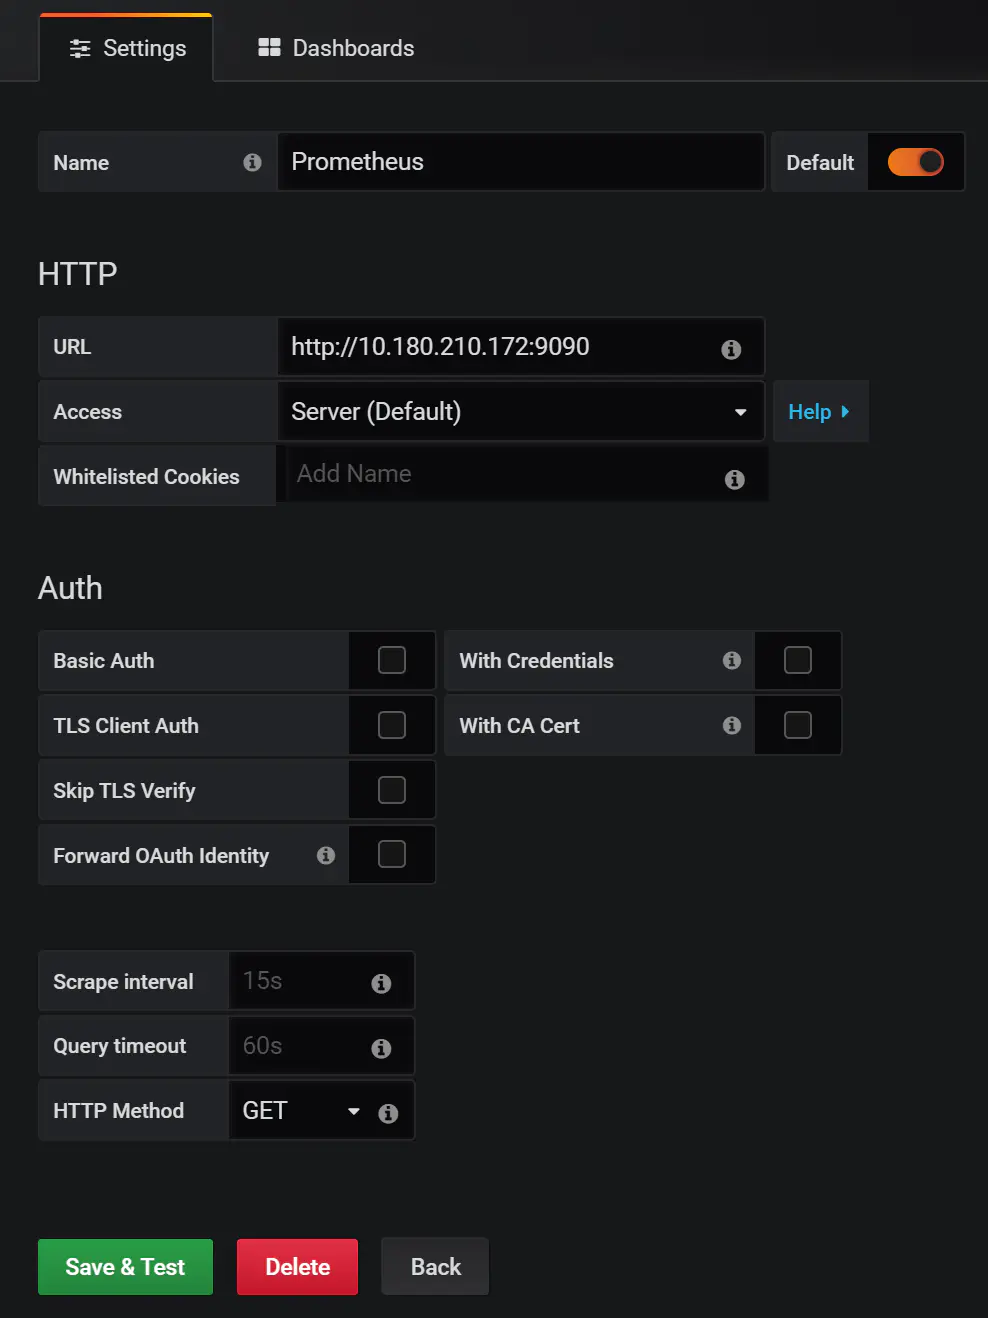
Grafana默认运行在3000端口。使用默认用户名密码(admin/admin)登录Grafana后,选择左侧菜单的Configuration -> Data Sources。

接下来点击右侧的Add data source按钮。在数据源类型选择中界面选择Prometheus。
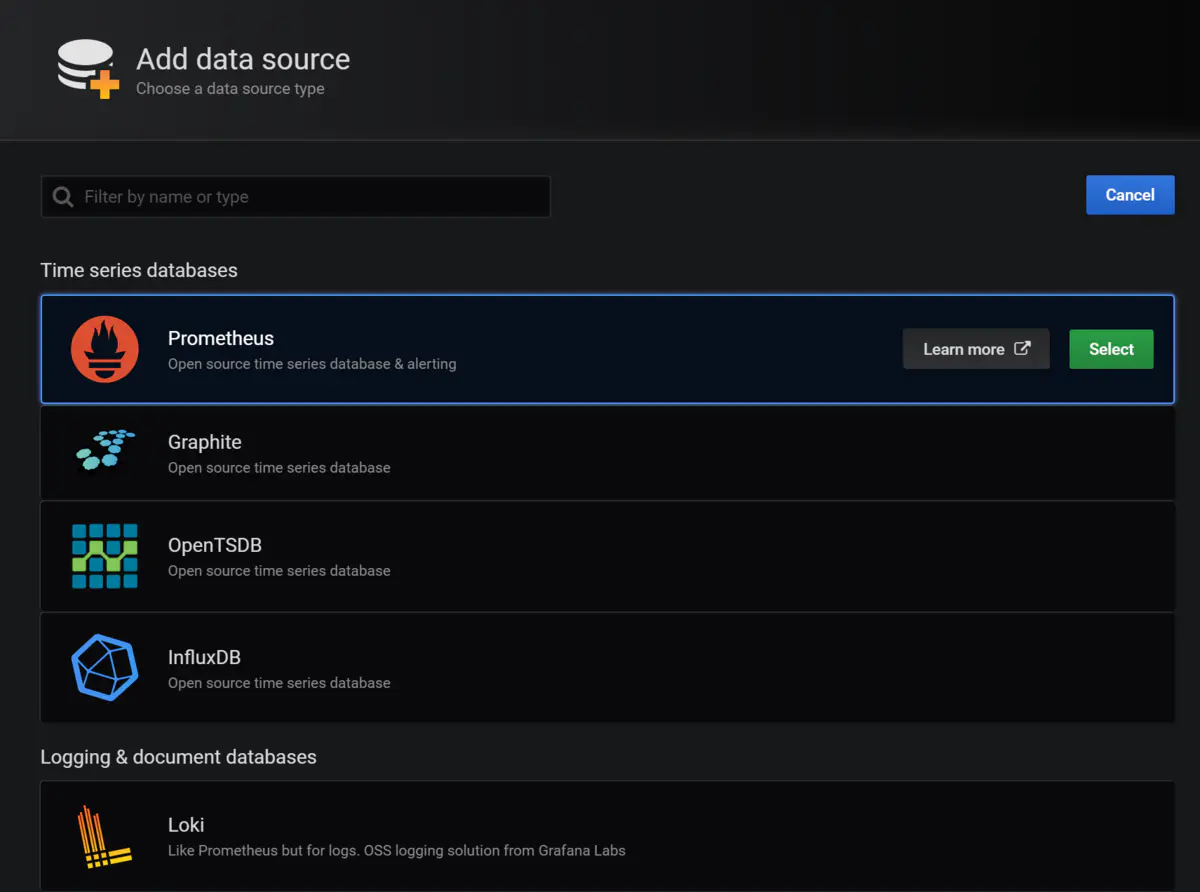
最后,将Prometheus的地址端口号填写入URL这一栏,点击下方的Save & Test按钮。如果配置无误,会弹出数据源正常连接的提示信息。
5.4.3 配置Dashboard
选择左侧菜单的Create -> Dashboard,然后选择Add Query。
Dashboard的Add Panel,Add Query。会进入到指标查询配置页面。
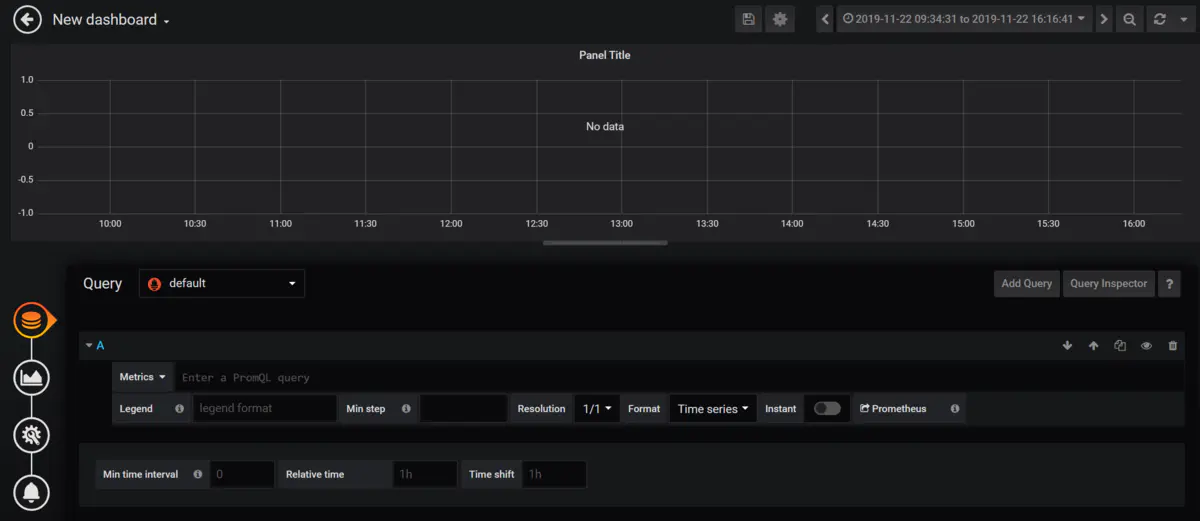
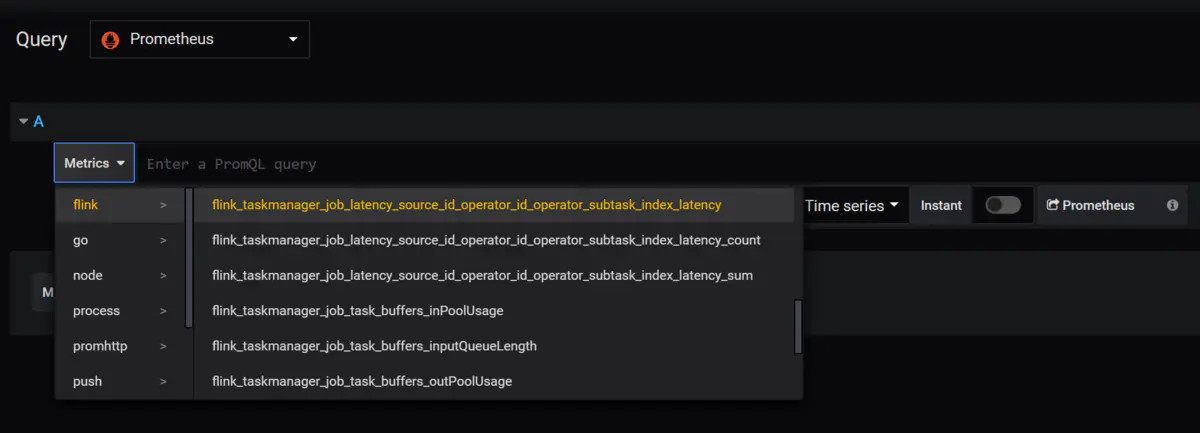
打开Query右侧的下拉列表,选择使用的数据源。

查询语句配置完毕后,页面上方会显示出监控数据,如图所示。
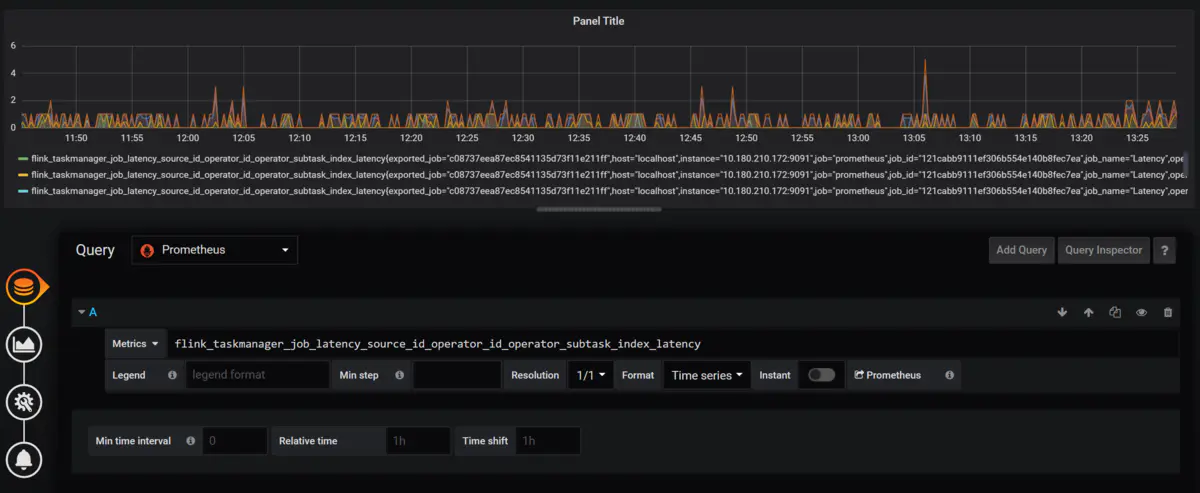
返回Dashboard后可以看到配置的监控图已经固定到了页面当中,方便以后查看。
作者:AlienPaul
链接:https://www.jianshu.com/p/5e91a1ac2959
来源:简书
著作权归作者所有。商业转载请联系作者获得授权,非商业转载请注明出处。