需求如下:

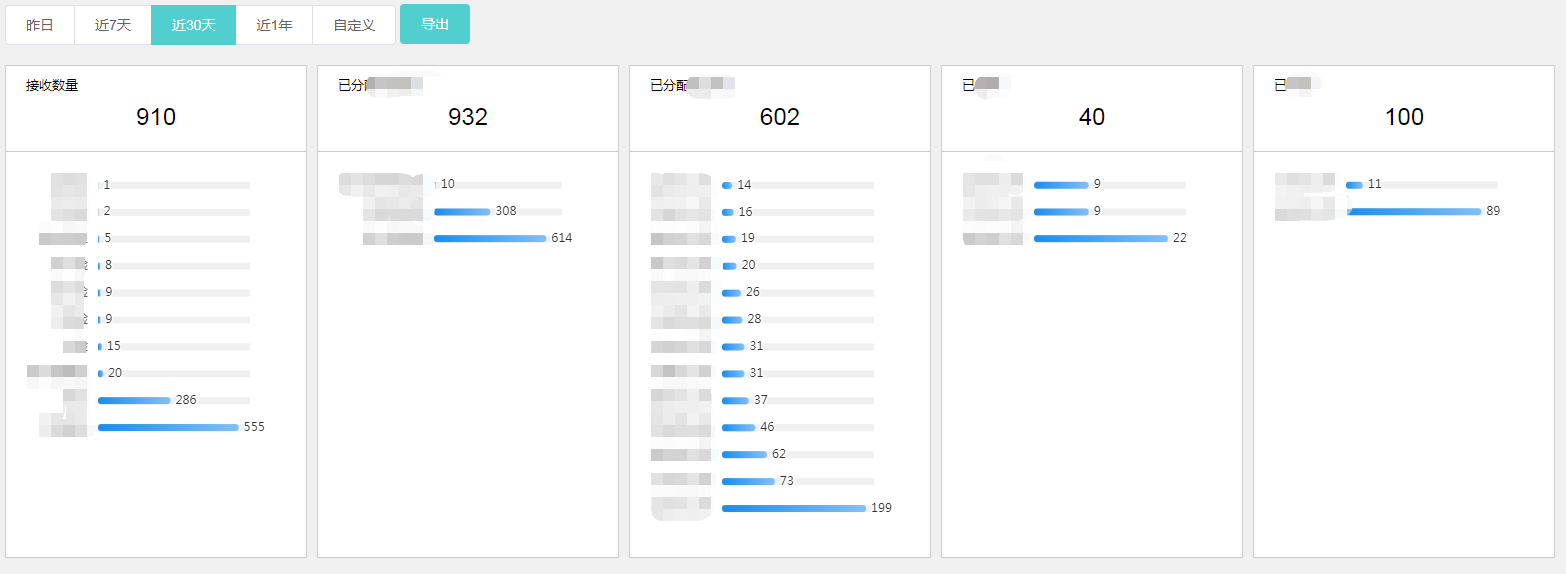
1. 需要渲染5个柱状图,根据查询的数据动态改变。
2. 图标高度根据查到的数量改变,超过一定高度后,可滚动显示当前图表。
3. 样式设置。
代码(基于vue):
html
    <div style="display: flex;">
      <div class="m-wrapper" v-for="(item, index) in tableDataList" :key="index">
        <div class="m-data">
          <div class="m-data-des">{{item.label}}</div>
          <div class="m-data-num">{{tableData[item.countProp]}}</div>
        </div>
        <div class="echarts-wrapper">
          <!-- 给每个挂载图表的dom一个ref -->
          <div class="main"  :ref="item.listProp" :key="item.listProp"> </div>
        </div>
      </div>
    </div>
定义的数据
    tableDataList: [{ // 记录tableList的字段,以便于循环
        listProp: 'received',
        countProp: 'receivedCount',
        label: '第一个图表名字'
      }, {
        listProp: 'productLine',
        countProp: 'productLineCount',
        label: '第二个图表名称'
      }, {
        listProp: 'branchCompany',
        countProp: 'branchCompanyCount',
        label: '第三个图表名称'
      }, {
        listProp: 'ended',
        countProp: 'endedCount',
        label: '第四个图表名称'
      }, {
        listProp: 'wined',
        countProp: 'winedCount',
        label: '第五个图表名称'
      }],
    option: {
          yAxis: {
            type: 'category',
            data: [],
            axisLine: {
              show: false
            },
            axisLabel: {
              margin: 10,
            },
            axisTick: { show: false }
          },
          xAxis: {
            type: 'value',
            show: false
          },
          grid: {
            left: 12,
            right: 26,
            bottom: 15,
            top: 20,
            containLabel: true
          },
          series: [{
              data: [],
              type: 'bar',
              showBackground: true, // 显示柱子灰色背影
              barWidth: '7px', // 固定柱子宽度
              // barGap:'0%',/*多个并排柱子设置柱子之间的间距*/
              // barCategoryGap: '0%',/*多个并排柱子设置柱子之间的间距*/
              axisLine: {
                show: false  // 不显示坐标轴
              },
              label: {
                show: true, // 显示柱子上的数量标识
                position: 'right', // 数量在柱子右侧
                valueAnimation: true
              },
              backgroundStyle: { // 背景色
                color: 'rgba(180, 180, 180, 0.2)'
              },
              itemStyle: {
                borderRadius: 4, // 柱子圆角
                color: new echarts.graphic.LinearGradient( // 柱子渐变色
                    0, 0, 1, 0,
                    [
                        {offset: 0, color: '#188df0'},
                        {offset: 1, color: '#83bff6'}
                    ]
                )
              }
          }]
      }
js:
    import * as echarts from 'echarts';
    getOption(yAxisData, seriesData) {
      const newOption = JSON.parse(JSON.stringify(this.option))
      this.$set(newOption.yAxis, 'data', yAxisData)
      this.$set(newOption.series[0], 'data', seriesData)
      return newOption
    },
    initEcharts() {
      this.tableDataList.forEach(ele => {
        // 循环加载数据
        const dom = this.$refs[ele.listProp][0]
        const list = this.tableData[ele.listProp]
        const yAxisData = list.map(item => item.typename)
        const seriesData = list.map(item => item.num)
        // 动态改变高度
        let height = yAxisData.length * 27 + 54
        dom.style.height = height +  'px'

        // 如果已经初始化过图表,则获取已有的图表,不再初始化
        let myChart = echarts.getInstanceByDom(dom)
        console.log(myChart)
        if (!myChart) {
          myChart = echarts.init(dom);
        }
       // 动态改变高度后需要resize更新下
        myChart.resize()
        myChart.setOption(this.getOption(yAxisData, seriesData))
      })
    },
注意点:
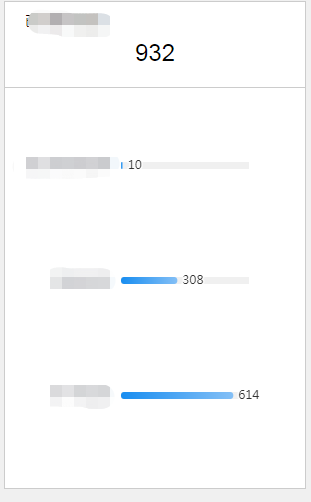
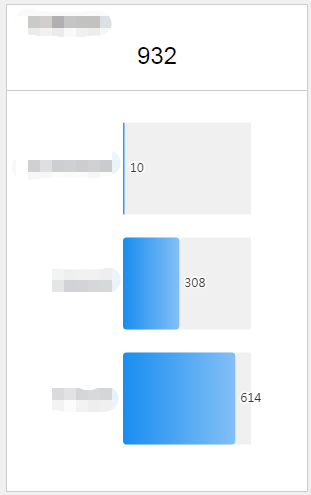
1. 如果图表的容器是固定的宽高,那么echart生成的柱状图是自适应容器的,即间距和柱子宽度可能会变化。
1).固定柱子宽度,可以设置barWidth的值,但此时柱子间距将会自适应,如果柱子数量较少,则间距会拉大。且barCategoryGap无效。

2). 设置barCategoryGap的话,间距固定,但是柱子宽度将会自适应,如果柱子很少,柱子宽度将会很大。

3) 如果想要控制柱子宽度和间距,可动态改变图表的宽高,根据返回数据的多少来确定图表容器的高度,设置后注意使用resize方法。
2)循环渲染图表的时候,注意标注不同的ref,参考上面js代码。
3)再次查询数据渲染图表时,可以先检测该dom是否已经挂载了图表,如果已经挂载,则不需要重新初始化。