第一种:
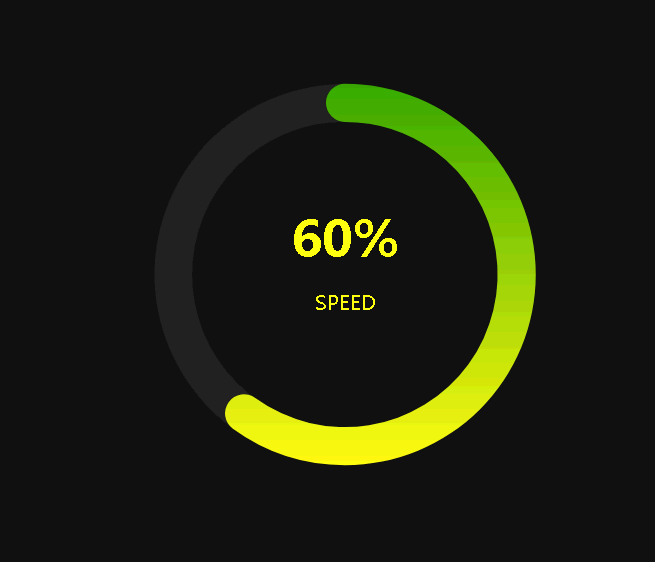


let num = 0;
option = {
    backgroundColor: '#111',
    title: [{
        text: 'SPEED',
        x: 'center',
        top: '52%',
        textStyle: {
            color: '#fdf914',
            fontSize: 20,
            fontWeight: '100',
        }
    }, {
        text: '60%',
        x: 'center',
        top: '42%',
        textStyle: {
            fontSize: '50',
            color: '#fdf914',
            fontFamily: 'Lato',
            foontWeight: '600',
        },
    }],
    polar: {
        radius: ['40%', '50%'],
        center: ['50%', '50%'],
    },
    angleAxis: {
        max: 100,
        show: false,
    },
    radiusAxis: {
        type: 'category',
        show: true,
        axisLabel: {
            show: false,
        },
        axisLine: {
            show: false,

        },
        axisTick: {
            show: false
        },
    },
    series: [
        {
            name: '',
            type: 'bar',
            roundCap: true,
            barWidth: 60,
            showBackground: true,
            backgroundStyle: {
                color: 'rgba(66, 66, 66, .3)',
            },
            data: [60],
            coordinateSystem: 'polar',

            itemStyle: {
                normal: {
                    color: new echarts.graphic.LinearGradient(0, 1, 0, 0, [{
                        offset: 0,
                        color: '#fdf914'
                    }, {
                        offset: 1,
                        color: '#38a700'
                    }]),
                }
            }

        },


    ]
};
function numb(){
    num = num+5
    myChart.setOption(option, true)
}
setInterval(function() {
    numb()
}, 100);
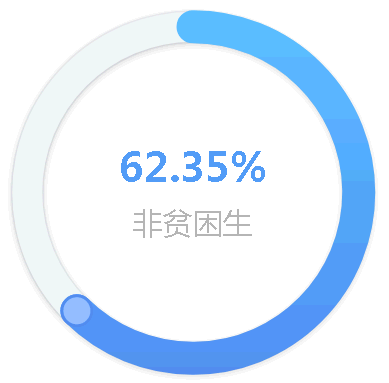
var getfpkszb = [62.35]; //非贫困生占比
var getfpkszb1 = [0.01];
var getfpksrs = [1265]; //非贫困生人数


//贫困生分布-非贫困生图表
option = {
    backgroundColor: '#fff',

    title: {
        text: getfpkszb + '%',
        textStyle: {
            color: '#559BF4',
            fontSize: 40
        },

        subtext: '非贫困生',
        subtextStyle: {
            color: '#B1B1B1',
            fontSize: 30
        },
        itemGap: 20,
        left: 'center',
        top: '43%'
    },
    tooltip: {
        formatter: function(params) {
            return '<span style="color: #fff;">非贫困生人数:' + getfpksrs + '人</span>';
        }
    },
    angleAxis: {
        max: 100,
        clockwise: true, // 逆时针
        // 隐藏刻度线
        show: false
    },
    radiusAxis: {
        type: 'category',
        show: true,
        axisLabel: {
            show: false,
        },
        axisLine: {
            show: false,

        },
        axisTick: {
            show: false
        },
    },
    polar: {
        center: ['50%', '50%'],
        radius: '100%' //图形大小
    },
    series: [{
        stack: '测试',
        type: 'bar',
        data: getfpkszb,
        showBackground: true,
        backgroundStyle: {
            color: '#EFF2F5',
            borderColor: '#EFF2F5',
            borderWidth: 3
        },
        coordinateSystem: 'polar',
        roundCap: true,
        barWidth: 30,
        silent: true,
        itemStyle: {
            normal: {
                opacity: 1,
                color: new echarts.graphic.LinearGradient(0, 0, 0, 1, [{
                    offset: 0,
                    color: '#5CBEFF'
                }, {
                    offset: 1,
                    color: '#518FEF'
                }]),
                borderColor: new echarts.graphic.LinearGradient(0, 0, 0, 1, [{
                    offset: 0,
                    color: '#5CBEFF'
                }, {
                    offset: 1,
                    color: '#518FEF'
                }]),
                borderWidth: 3
            }
        },
    }, {
        stack: '测试',
        type: 'bar',
        data: getfpkszb1,
        showBackground: true,
        backgroundStyle: {
            color: '#EFF2F5',
            shadowColor: 'rgba(0, 0, 0, 0.2)',
            shadowBlur: 10,
            shadowOffsetY: 2,

        },
        coordinateSystem: 'polar',
        roundCap: true,
        barWidth: 30,
        itemStyle: {
            color: '#90BDFF',
            borderColor: 'rgba(81,143,239, 1)',
            borderWidth: 3
        },
    }]
};
第二种:条形图
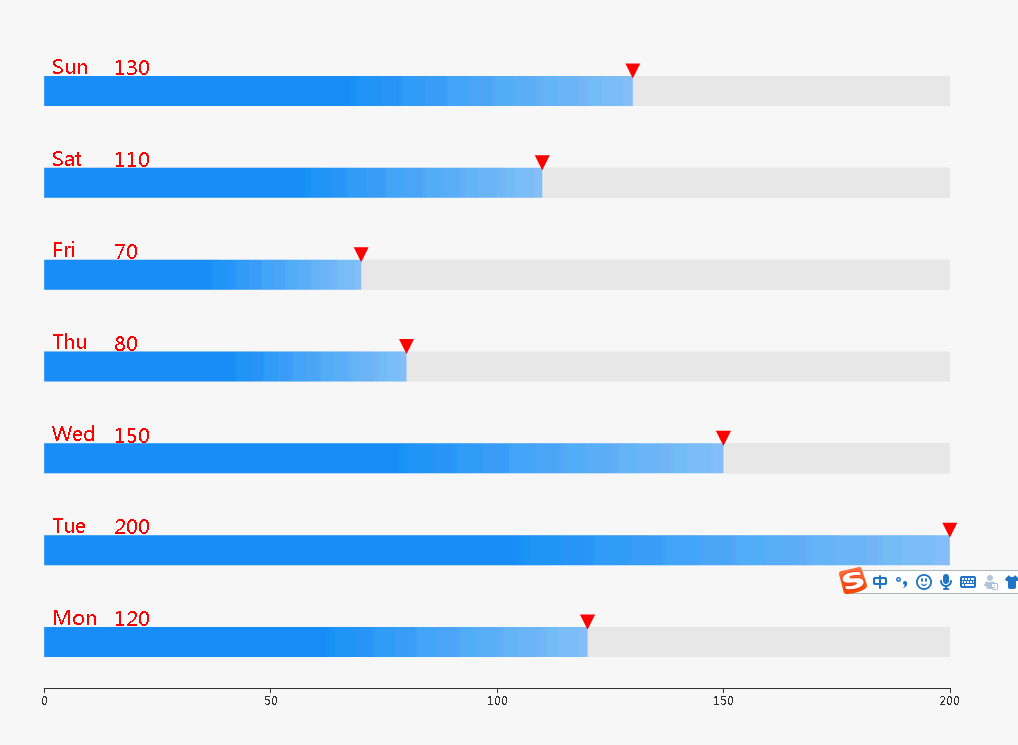
代码:
option = {
    yAxis: {
        type: 'category',
        axisLabel: {
            inside: true,
            verticalAlign:'bottom',
            lineHeight:'45',
            textStyle: {
                color: '#f00',
                fontSize:'20'
            }
        },
        axisLine:{
            show:false
        },
        axisTick:{
            show:false
        },
        z:10,
        data: ['Mon', 'Tue', 'Wed', 'Thu', 'Fri', 'Sat', 'Sun']
    },
    xAxis: {
        type: 'value',
        splitLine:{
            show:false
        }
    },
    series: [{
        data: [120, 200, 150, 80, 70, 110, 130],
        type: 'bar',
        barWidth:'30px',
        showBackground: true,
        backgroundStyle: {
            color: 'rgba(220, 220, 220, 0.8)'
        },
        label: {
            show: true,
            position: [70,-16],
            fontSize:20,
            color:'#f00'
        },
        markPoint:{
            symbol:'path:// M 100 100 L 300 100 L 200 300 z',//箭头svg,echart内置
            symbolSize : 15,
            //symbolRotate:180,
            symbolOffset:[0,'-20px'],
            itemStyle:{
              color:'#f00'
            },
            data:[
                {xAxis:120,yAxis:'Mon'},
                {xAxis:200,yAxis:'Tue'},
                {xAxis:150,yAxis:'Wed'},
                {xAxis:80,yAxis:'Thu'},
                {xAxis:70,yAxis:'Fri'},
                {xAxis:110,yAxis:'Sat'},
                {xAxis:130,yAxis:'Sun'},
            ]
        },

        itemStyle: {
                color: new echarts.graphic.LinearGradient(
                    1, 0, 0, 0,
                    [
                        {offset: 0, color: '#83bff6'},
                        {offset: 0.5, color: '#188df0'},
                        {offset: 1, color: '#188df0'}
                    ]
                )
            },
    }]
};
加上rich得到单位的版本
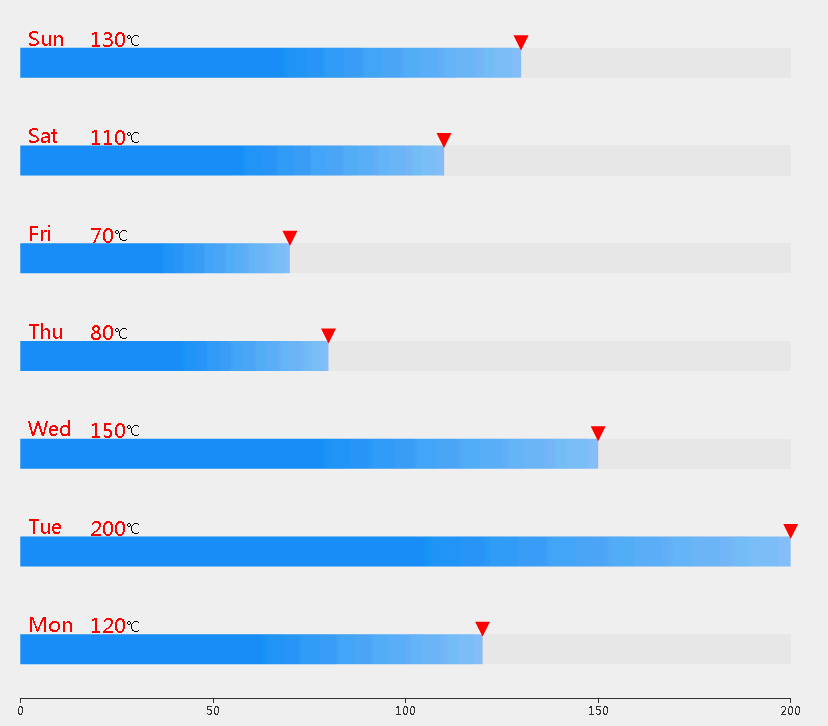
option = {
    yAxis: {
        type: 'category',
        axisLabel: {
            inside: true,
            verticalAlign:'bottom',
            lineHeight:'45',
            textStyle: {
                color: '#f00',
                fontSize:'20'
            }
        },
        axisLine:{
            show:false
        },
        axisTick:{
            show:false
        },
        z:10,
        data: ['Mon', 'Tue', 'Wed', 'Thu', 'Fri', 'Sat', 'Sun']
    },
    xAxis: {
        type: 'value',
        splitLine:{
            show:false
        }
    },
    series: [{
        data: [120, 200, 150, 80, 70, 110, 130],
        type: 'bar',
        barWidth:'30px',
        showBackground: true,
        backgroundStyle: {
            color: 'rgba(220, 220, 220, 0.8)'
        },
        label: {
            show: true,
            position: [70,-16],
            fontSize:20,
            color:'#f00',
            formatter:function(data){
                return data.value + "{x|℃}"
            },
            rich: {
                a: {
                    color: 'red',
                    lineHeight: 10
                },
                b: {
                    backgroundColor: {
                        image: 'xxx/xxx.jpg'
                    },
                    height: 40
                },
                x: {
                    fontSize: 14,
                    fontFamily: 'Microsoft YaHei',
                    borderColor: '#449933',
                    borderRadius: 4
                },

            }
        },
        markPoint:{
            symbol:'path:// M 100 100 L 300 100 L 200 300 z',//箭头svg,echart内置
            symbolSize : 15,
            //symbolRotate:180,
            symbolOffset:[0,'-20px'],
            itemStyle:{
              color:'#f00'
            },
            data:[
                {xAxis:120,yAxis:'Mon'},
                {xAxis:200,yAxis:'Tue'},
                {xAxis:150,yAxis:'Wed'},
                {xAxis:80,yAxis:'Thu'},
                {xAxis:70,yAxis:'Fri'},
                {xAxis:110,yAxis:'Sat'},
                {xAxis:130,yAxis:'Sun'},
            ]
        },

        itemStyle: {
                color: new echarts.graphic.LinearGradient(
                    1, 0, 0, 0,
                    [
                        {offset: 0, color: '#83bff6'},
                        {offset: 0.5, color: '#188df0'},
                        {offset: 1, color: '#188df0'}
                    ]
                )
            },
    }]
};
第三种:
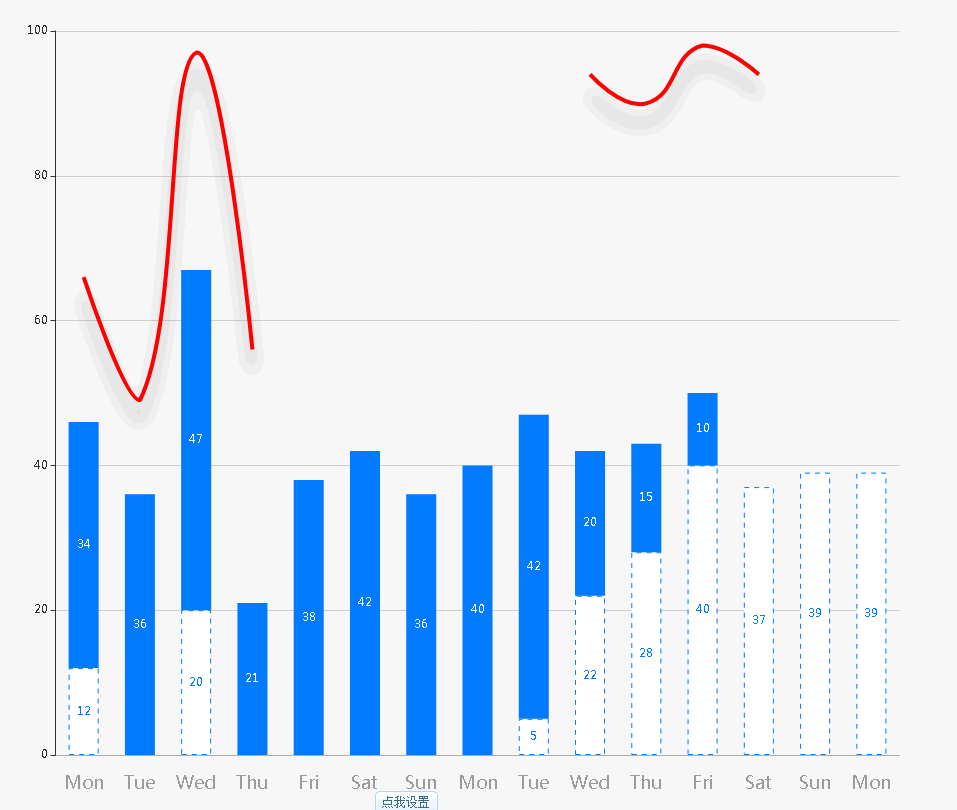
option = {
    xAxis: {
        type: 'category',
        data: ['Mon', 'Tue', 'Wed', 'Thu', 'Fri', 'Sat', 'Sun']
    },
    xAxis: [{
        type: 'category',
        color: '#59588D',
        data: ['Mon', 'Tue', 'Wed', 'Thu', 'Fri', 'Sat', 'Sun','Mon', 'Tue', 'Wed', 'Thu', 'Fri', 'Sat', 'Sun','Mon'],
        axisLabel: {
            margin: 20,
            color: '#999',
            textStyle: {
                fontSize: 18
            },
        },
        axisLine: {
            lineStyle: {
                color: 'rgba(107,107,107,0.37)',
            }
        },
        axisTick: {
            show: false
        },
    }],
    yAxis: {
        type: 'value'
    },
    series: [
            {
              name: '邮件营销',
              type: 'bar',
              stack: '广告',
              barWidth: 30,
              barGap:"-20%",
              label: {
                show: true,
                position: 'inside',
                color: '#0079FE'
              },
              itemStyle: {
                normal: {
                  color: '#fff',
                  barBorderColor: '#0079FE',
                  barBorderWidth: 1,
                  // barBorderRadius: 0,
                  borderType: 'dashed'
                }
              },
              data: [12, '-', 20, '-', '-', '-', '-', '-', 5, 22, 28, 40, 37, 39, 39]
            },
            {
              name: '联盟广告',
              type: 'bar',
              barGap:"20%",
              stack: '广告',
              label: {
                show: true,
                position: 'inside'
              },
              itemStyle: {
                normal: {
                  color: '#0079FE'
                }
              },
              data: [34, 36, 47, 21, 38, 42, 36, 40, 42, 20, 15, 10, '-', '-', '-','-','-']
            },
            {
              data: [20, 13, 30, 35, '-', '-', '-','-','-',52, 47, 48, 57],
              type: 'line',
              smooth:true,
              name: '视频广告',
              symbol:"none",
              stack: '广告',
              lineStyle: {
                    color: 'red',
                     4,
                    shadowColor: 'rgba(0, 0, 0, 0.3)',//设置折线阴影
                    shadowBlur: 15,
                    shadowOffsetY: 20,
                },

            }
          ]
};
第四种:
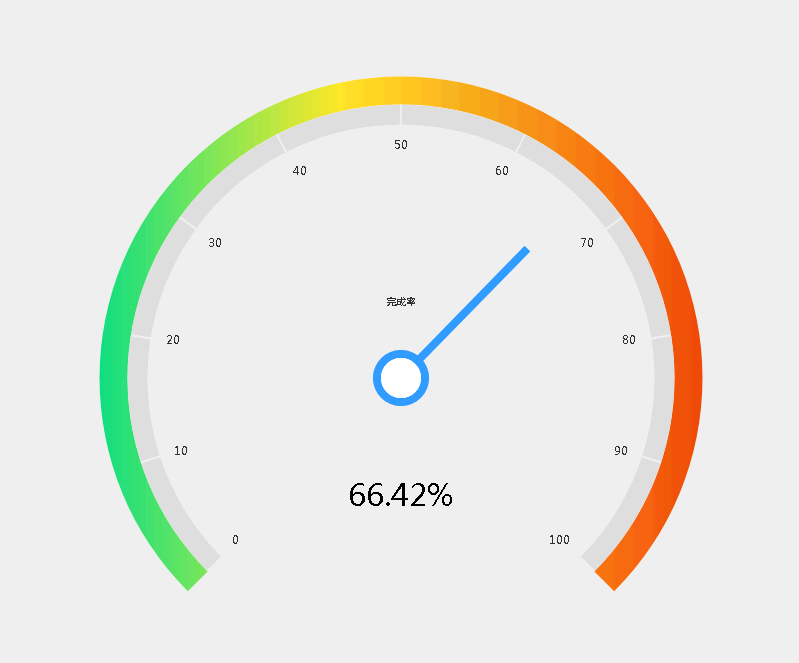
option = {
    tooltip: {
        formatter: '{a} <br/>{b} : {c}%'
    },
    toolbox: {
        feature: {
            restore: {},
            saveAsImage: {}
        }
    },
    /*"itemStyle": {
        borderColor: 'red',
        borderWidth: 2
    },*/

    series: [
        {
            name: '业务指标',
            type: 'gauge',
            detail: {formatter: '{value}%'},
            data: [{value: 50, name: '完成率'}],
            /*pointer: {
                show: true,
                color:'red',
                '2',
                length:'50%'
            },*/
            axisLine: {
                lineStyle: {
                     28,
                    color: [
                        /*[0, '#333'],
                        [0.5, new echarts.graphic.LinearGradient(
                            0, 1, 0, 0,
                            [{
                                offset: 0,
                                color: '#1bde7e'
                            }, {
                                offset: 0.8,
                                color: 'rgb(235,205,6)'
                            }]
                        )],*/
                        [1, new echarts.graphic.LinearGradient(
                            0, 0, 1, 0,
                            [{
                                offset: 0,
                                color: '#13df82'
                            }, {
                                offset: 0.4,
                                color: '#fbe129'
                            },
                            {
                                offset: 1,
                                color: '#ee4b0c'
                            }]
                        )],
                        //[1, 'rgb(13,211,97)']
                    ],
                }
            },
            axisLabel: {
                show: false,
            },
            "axisTick": {
                show: false,

            },
            "splitLine": {
                "show": false,
            },
            "itemStyle": {
                borderColor: '#3399ff',
                //color:'#3399ff',
                borderWidth: 8
            },
            "title": {
                color: '#333',
                "fontSize": 10,
                "offsetCenter": [0, "-25%"]
            },
            /*"data": [{
                "name": "",
                "value": 30,
            }],*/
            pointer: {
                show:true,
                 0,
                //color:'red',
                length: '60%'
            },
        },
        /*{
            name: '业务指标',
            type: 'gauge',
            detail: {formatter: '{value}%'},
            data: [{value: 50, name: '完成率'}]
        },*/
        { //指针外环
            "type": 'pie',
            "hoverAnimation": false,
            "legendHoverLink": false,
            "radius": ['5%', '7%'],
            center: ['50%', '50%'],
            tooltip:{
                show:false
            },
            "label": {
                "normal": {
                    "show": false
                }
            },
            "labelLine": {
                "normal": {
                    "show": false
                }
            },

            "data": [{
                "value": 100,
                itemStyle: {
                    normal: {
                        color: "#3399ff"
                    }
                }
            }]
        },

        { //指针内环
            "type": 'pie',
            "hoverAnimation": false,
            "legendHoverLink": false,
            "radius": ['0%', '5%'],
            center: ['50%', '50%'],
            tooltip:{
                show:false
            },
            "label": {
                "normal": {
                    "show": false
                }
            },
            "labelLine": {
                "normal": {
                    "show": false
                }
            },
            "data": [{
                "value": 20,
                itemStyle: {
                    normal: {
                        color: "#fff"
                    }
                }
            }]
        },
        {
            name: "内层盘",
            type: "gauge",
            z: 6,
           radius: "68%",
            startAngle: 225,
            endAngle: -45,

            //center: center, //整体的位置设置
            axisLine: {
                lineStyle: {
                    // 属性lineStyle控制线条样式//控制外圈位置
                    "color": [
                        /*[
                            30 / 100, new echarts.graphic.LinearGradient(
                                0, 0, 1, 0, [{
                                        offset: 0,
                                        color: '#50e2d7'
                                    },
                                    {
                                        offset: 1,
                                        color: '#99f8a4'
                                    }
                                ]
                            )
                        ],*/
                        [
                            1, '#ddd'
                        ]
                    ],
                     20,
                    //opacity: 0.9 //控制外圈位置,颜色,宽度,透明度
                }
            },
            axisTick: {
                show: false
            },
            splitLine: {
                show: true
            },
            axisLabel: {
                show: true,
                color:'#333'
            },
            /*pointer: {
                show: true,
                color:'blue',
                '10',
                length:'20%'
            },*/
            // data: [
            //   {
            //     show: false,
            //     value:0.8
            //   }
            // ],
            detail: {
                show: 0
            }
        }

    ]
};

setInterval(function () {
    option.series[0].data[0].value = (Math.random() * 100).toFixed(2) - 0;
    myChart.setOption(option, true);
},2000);