ELKF应用场景:
1) datasource->logstash->elasticsearch->kibana
2) datasource->filebeat->logstash-> elasticsearch->kibana
3) datasource->filebeat->logstash->redis/kafka->logstash-> elasticsearch->kibana
4) kafka->logstash-> elasticsearch->kibana
5) datasource->filebeat->kafka->logstash->elasticsearch->kibana(最常用)
6) filebeatSSL加密传输
7) datasource->logstash->redis/kafka->logstash->elasticsearch->kibana
8) mysql->logstash->elasticsearch->kibana
上述主要是对下面传输处理场景的一个概括,从数据源开始,如何采集,用什么工具采集,采集到哪里,经过怎样的处理过滤,传输到哪里,怎样进行展示
输入、输出、过滤主要通过插件实现(包含多类型插件),插件教程参考官网
https://www.elastic.co/guide/en/logstash/current/index.html
【安装部署这种官网或者社区已经很完善,此处不做赘述,可自行去官网查看】
【redis集群安装文档前面已经说明过,可自行查看】
前提条件
1) java环境:jdk8;
2) elk已搭建完毕;
3) elasticsearch、kibana、logstash版本最好保持一致,目前环境是5.6.10版本
4) logstash建议使用root用户(拥有足够权限去搜集所需日志文件);
5) elasticsearch使用普通用户安装,新版本已限制不允许root安装;
6) filebeat安装完毕
启动命令:
7) logstash启动命令:
*nohup ./bin/logstash -f .conf –config.reload.automatic >/dev/null 2>/dev/null &
8) filebeat启动命令: nohup ./filebeat -e -c filebeat.yml>/dev/null 2>/dev/null &
9)elasticsearch启动命令:./elasticsearch -d
10)kibana启动命令:nohup ./bin/kibana &
Logstash启动命令:--config.reload.automatic自动重新加载配置文件,无需重启logstash
filebeat启动命令:-e 参数指定输出日志到stderr,-c参数指定配置文件路径
场景介绍
简单模式:以logstash作为日志搜索器
架构:logstash采集、处理、转发到elasticsearch存储,在kibana进行展示
特点:这种结构因为需要在各个服务器上部署 Logstash,而它比较消耗 CPU 和内存资源,所以比较适合计算资源丰富的服务器,否则容易造成服务器性能下降,甚至可能导致无法正常工作。

Demo1:
test1.conf:
控制台输入,不经过任何处理转换(仅传输),输出到控制台(或者elasticsearch、文件----自行选择):
#控制台输入

input { stdin { } }

output {

     #codec输出到控制台

stdout { codec=> rubydebug }

#输出到elasticsearch

elasticsearch {

        hosts => "node18:9200"

        codec => json

        }

#输出到文件

file {

    path => "/usr/local/logstash-5.6.10/data/log/logstash/all.log" #指定写入文件路径

    flush_interval => 0                  # 指定刷新间隔,0代表实时写入

    codec => json

    }

}
安全模式:beats(Filebeat、Metricbeat、Packetbeat、Winlogbeat等)作为日志搜集器
Packetbeat(搜集网络流量数据);
Topbeat(搜集系统、进程和文件系统级别的 CPU 和内存使用情况等数据);
Filebeat(搜集文件数据)-------最常用
Winlogbeat(搜集 Windows 事件日志数据)。
架构:
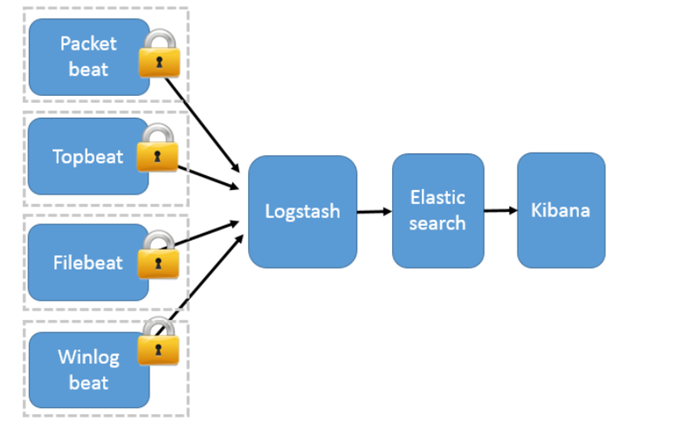
工作模式:Beats 将搜集到的数据发送到 Logstash,经 Logstash 解析、过滤后,将其发送到 Elasticsearch 存储,并由 Kibana 呈现给用户;
模式特点:这种架构解决了 Logstash 在各服务器节点上占用系统资源高的问题。相比 Logstash,Beats 所占系统的 CPU 和内存几乎可以忽略不计。另外,Beats 和 Logstash 之间支持 SSL/TLS 加密传输,客户端和服务器双向认证,保证了通信安全。
因此这种架构适合对数据安全性要求较高,同时各服务器性能比较敏感的场景
Demo2:
filebeat.yml:
################# Filebeat Configuration Example ########################


# This file is an example configuration file highlighting only the most common

# options. The filebeat.full.yml file from the same directory contains all the

# supported options with more comments. You can use it as a reference.

#

# You can find the full configuration reference here:

# https://www.elastic.co/guide/en/beats/filebeat/index.html


#===================== Filebeat prospectors =====================


filebeat.prospectors:


# Each - is a prospector. Most options can be set at the prospector level, so

# you can use different prospectors for various configurations.

# Below are the prospector specific configurations.


- input_type: log


  # Paths that should be crawled and fetched. Glob based paths.

  paths:

    - /home/admin/helloworld/logs/*.log

    #- c:programdataelasticsearchlogs*


  # Exclude lines. A list of regular expressions to match. It drops the lines that are

  # matching any regular expression from the list.

  #exclude_lines: ["^DBG"]


  # Include lines. A list of regular expressions to match. It exports the lines that are

  # matching any regular expression from the list.

  #include_lines: ["^ERR", "^WARN"]


  # Exclude files. A list of regular expressions to match. Filebeat drops the files that

  # are matching any regular expression from the list. By default, no files are dropped.

  #exclude_files: [".gz$"]


  # Optional additional fields. These field can be freely picked

  # to add additional information to the crawled log files for filtering

  #fields:

  #  level: debug

  #  review: 1


  ### Multiline options


  # Mutiline can be used for log messages spanning multiple lines. This is common

  # for Java Stack Traces or C-Line Continuation


  # The regexp Pattern that has to be matched. The example pattern matches all lines starting with [

  #multiline.pattern: ^[


  # Defines if the pattern set under pattern should be negated or not. Default is false.

  #multiline.negate: false


  # Match can be set to "after" or "before". It is used to define if lines should be append to a pattern

  # that was (not) matched before or after or as long as a pattern is not matched based on negate.

  # Note: After is the equivalent to previous and before is the equivalent to to next in Logstash

  #multiline.match: after


#====================== General =============================


# The name of the shipper that publishes the network data. It can be used to group

# all the transactions sent by a single shipper in the web interface.

#name:


# The tags of the shipper are included in their own field with each

# transaction published.

#tags: ["service-X", "web-tier"]


# Optional fields that you can specify to add additional information to the

# output.

#fields:

#  env: staging


#======================= Outputs ===========================


# Configure what outputs to use when sending the data collected by the beat.

# Multiple outputs may be used.


#-------------------------- Elasticsearch output ------------------------------

#output.elasticsearch:

  # Array of hosts to connect to.

  # hosts: ["localhost:9200"]


  # Optional protocol and basic auth credentials.

  #protocol: "https"

  #username: "elastic"

  #password: "changeme"


#--------------------------- Logstash output --------------------------------

output.logstash:

  # The Logstash hosts

  hosts: ["192.168.80.34:5044"]


  # Optional SSL. By default is off.

  # List of root certificates for HTTPS server verifications

  #ssl.certificate_authorities: ["/etc/pki/root/ca.pem"]


  # Certificate for SSL client authentication

  #ssl.certificate: "/etc/pki/client/cert.pem"


  # Client Certificate Key

  #ssl.key: "/etc/pki/client/cert.key"


#=========================== Logging =======================


# Sets log level. The default log level is info.

# Available log levels are: critical, error, warning, info, debug

#logging.level: debug


# At debug level, you can selectively enable logging only for some components.

# To enable all selectors use ["*"]. Examples of other selectors are "beat",

# "publish", "service".

#logging.selectors: ["*"]
logstash配置文件
test2.conf:
input {

    beats {

    port => 5044

    codec => "json"

}

}

#filters{

#…………(后续进行说明)

#}


output {

    # 输出到控制台

    # stdout { }


    # 输出到redis

    redis {

        host => "192.168.80.32"   # redis主机地址

        port => 6379              # redis端口号

        password => "123456"          # redis 密码

        #db => 8                   # redis数据库编号

        data_type => "channel"    # 使用发布/订阅模式

        key => "logstash_list_0"  # 发布通道名称

}

#输出到kafka

    kafka {

        bootstrap_servers => "192.168.80.42:9092"

        topic_id         => "test"

       }

#输出到es

elasticsearch {

        hosts => "node18:9200"

        codec => json

        }

}
消息模式filebeat->logstash->kafka->logstash->es
Beats 还不支持输出到消息队列(新版本除外:5.0版本及以上),所以在消息队列前后两端只能是 Logstash 实例。logstash从各个数据源搜集数据,不经过任何处理转换仅转发出到消息队列(kafka、redis、rabbitMQ等),后logstash从消息队列取数据进行转换分析过滤,输出到elasticsearch,并在kibana进行图形化展示
架构(Logstash进行日志解析所在服务器性能各方面必须要足够好):
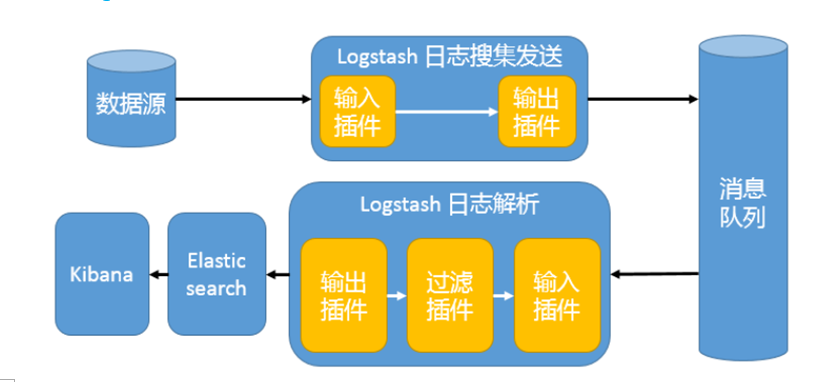
模式特点:这种架构适合于日志规模比较庞大的情况。但由于 Logstash 日志解析节点和 Elasticsearch 的负荷比较重,可将他们配置为集群模式,以分担负荷。引入消息队列,均衡了网络传输,从而降低了网络闭塞,尤其是丢失数据的可能性,但依然存在 Logstash 占用系统资源过多的问题
工作流程:Filebeat采集—> logstash转发到kafka—> logstash处理从kafka缓存的数据进行分析—> 输出到es—> 显示在kibana
Msg1.conf:
input {

    beats {

    port => 5044

    codec => "json"

       }

    syslog{

       }

}


#filter{

#

#}


output {

    # 输出到控制台

    # stdout { }


    # 输出到redis

    redis {

        host => "192.168.80.32"   # redis主机地址

        port => 6379              # redis端口号

        password => "123456"          # redis 密码

       #db => 8                   # redis数据库编号

        data_type => "channel"    # 使用发布/订阅模式

        key => "logstash_list_0"  # 发布通道名称

    }

    #输出到kafka

    kafka {

        bootstrap_servers => "192.168.80.42:9092"

        topic_id          => "test"

       }

}
Msg2.conf:
input{

    kafka {

        bootstrap_servers => "192.168.80.42:9092"

           topics          => ["test"]

           #decroate_events   => true

        group_id          => "consumer-test"(消费组)

           #decroate_events  => true

        auto_offset_reset => "earliest"(初始消费,相当于from beginning,不设置,相当于是监控启动后的kafka的消息生产)

   }

}

#filter{

#}

output {

       elasticsearch {

       hosts => "192.168.80.18:9200"

       codec => json

       }

}
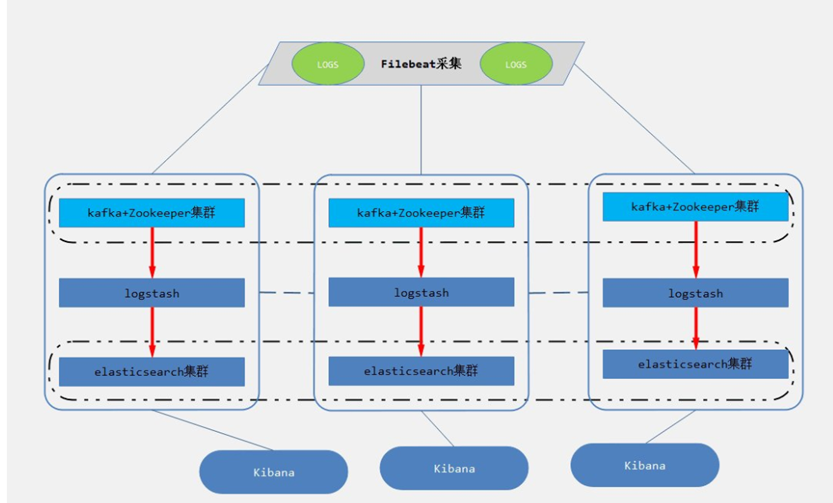
消息模式filebeat->kafka->logstash->es
filebeat新版本(5.0以上)支持直接支持输出到kafka,而无需经过logstash接收转发到kafka.
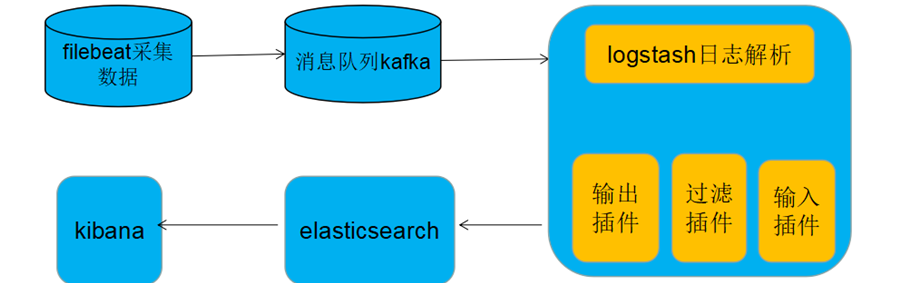
Filebeat采集完毕直接入到kafka消息队列,进而logstash取出数据,进行处理分析输出到es,并在kibana进行展示。
filebeat.yml:
################# Filebeat Configuration Example #########################


# This file is an example configuration file highlighting only the most common

# options. The filebeat.full.yml file from the same directory contains all the

# supported options with more comments. You can use it as a reference.

#

# You can find the full configuration reference here:

# https://www.elastic.co/guide/en/beats/filebeat/index.html


#================== Filebeat prospectors===========================


filebeat.prospectors:


# Each - is a prospector. Most options can be set at the prospector level, so

# you can use different prospectors for various configurations.

# Below are the prospector specific configurations.


- input_type: log


  # Paths that should be crawled and fetched. Glob based paths.

  paths:

    - /home/admin/helloworld/logs/*.log

    #- c:programdataelasticsearchlogs*


  # Exclude lines. A list of regular expressions to match. It drops the lines that are

  # matching any regular expression from the list.

  #exclude_lines: ["^DBG"]


  # Include lines. A list of regular expressions to match. It exports the lines that are

  # matching any regular expression from the list.

  #include_lines: ["^ERR", "^WARN"]


  # Exclude files. A list of regular expressions to match. Filebeat drops the files that

  # are matching any regular expression from the list. By default, no files are dropped.

  #exclude_files: [".gz$"]


  # Optional additional fields. These field can be freely picked

  # to add additional information to the crawled log files for filtering

  #fields:

  #  level: debug

  #  review: 1


  ### Multiline options


  # Mutiline can be used for log messages spanning multiple lines. This is common

  # for Java Stack Traces or C-Line Continuation


  # The regexp Pattern that has to be matched. The example pattern matches all lines starting with [

  #multiline.pattern: ^[


  # Defines if the pattern set under pattern should be negated or not. Default is false.

  #multiline.negate: false


  # Match can be set to "after" or "before". It is used to define if lines should be append to a pattern

  # that was (not) matched before or after or as long as a pattern is not matched based on negate.

  # Note: After is the equivalent to previous and before is the equivalent to to next in Logstash

  #multiline.match: after


#============================ General=========================


# The name of the shipper that publishes the network data. It can be used to group

# all the transactions sent by a single shipper in the web interface.

#name:


# The tags of the shipper are included in their own field with each

# transaction published.

#tags: ["service-X", "web-tier"]


# Optional fields that you can specify to add additional information to the

# output.

#fields:

#  env: staging


#======================== Outputs ============================


# Configure what outputs to use when sending the data collected by the beat.

# Multiple outputs may be used.


#-------------------------- Elasticsearch output ------------------------------

#output.elasticsearch:

  # Array of hosts to connect to.

  # hosts: ["localhost:9200"]


  # Optional protocol and basic auth credentials.

  #protocol: "https"

  #username: "elastic"

  #password: "changeme"


#----------------------------- Logstash output --------------------------------

#output.logstash:

  # The Logstash hosts

#  hosts: ["192.168.80.34:5044"]


#-----------------------------kafka  output-----------------------------------

#output.kafka:

#  enabled: true

#  hosts: ["192.168.80.42:9092,192.168.80.43:9092,192.168.80.44:9092"]

#  topics: 'test'

output.kafka:

  hosts: ["192.168.80.42:9092"]

  topic: test

  required_acks: 1


  # Optional SSL. By default is off.

  # List of root certificates for HTTPS server verifications

  #ssl.certificate_authorities: ["/etc/pki/root/ca.pem"]


  # Certificate for SSL client authentication

  #ssl.certificate: "/etc/pki/client/cert.pem"


  # Client Certificate Key

  #ssl.key: "/etc/pki/client/cert.key"


#======================== Logging ============================


# Sets log level. The default log level is info.

# Available log levels are: critical, error, warning, info, debug

#logging.level: debug


# At debug level, you can selectively enable logging only for some components.

# To enable all selectors use ["*"]. Examples of other selectors are "beat",

# "publish", "service".

#logging.selectors: ["*"]
logstash.conf:
input{

    kafka {

        bootstrap_servers => "192.168.80.42:9092"

            topics          => ["test"]

         group_id       => "consumer-test"

         #decroate_events  => true

       auto_offset_reset => "earliest"

   }


}

#flter{

#

#}


output {
       elasticsearch {

       hosts => "192.168.80.18:9200"

       codec => json

       }


}
FilebeatSSL加密传输
FilebeatSSL加密传输(增强安全性,仅配置了秘钥和证书的filebeat服务器和logstash服务器才能进行日志文件数据的传输):
参考文档: https://blog.csdn.net/zsq12138/article/details/78753369
参考文档:https://blog.csdn.net/Gamer_gyt/article/details/69280693?locationNum=5&fps=1
Logstash的配置文件:
注释:
ssl_certificate_authorities :filebeat端传来的证书所在位置
ssl_certificate => 本端生成的证书所在的位置
ssl_key => 本端生成的密钥所在的位置
ssl_verify_mode => "force_peer"
beat.conf:
input {

    beats {

    port => 5044

    codec => "json"

    ssl => true

   ssl_certificate_authorities => ["/usr/local/logstash-5.6.10/pki/tls/certs/filebeat.crt"]

   ssl_certificate => "/usr/local/logstash-5.6.10/pki/tls/certs/logstash.crt"

   ssl_key => "/usr/local/logstash-5.6.10/pki/tls/private/logstash.key"

ssl_verify_mode => "force_peer"#(需与ssl_certificate_authorities一起使用)

       }

    syslog{

       }

}


output {

    # 输出到控制台

    # stdout { }


    # 输出到redis

    redis {

        host => "192.168.80.32"   # redis主机地址

        port => 6379              # redis端口号

        password => "123456"          # redis 密码

       #db => 8                   # redis数据库编号

        data_type => "channel"    # 使用发布/订阅模式

        key => "logstash_list_0"  # 发布通道名称

    }

    #输出到kafka

    kafka {

        bootstrap_servers => "192.168.80.42:9092"

        topic_id          => "test"

       }

    #输出到es

    elasticsearch {

       hosts => "node18:9200"

       codec => json

       }


}
filebeat的配置文件:
filebeat.yml:
################ #Filebeat Configuration Example #####################


# This file is an example configuration file highlighting only the most common

# options. The filebeat.full.yml file from the same directory contains all the

# supported options with more comments. You can use it as a reference.

#

# You can find the full configuration reference here:

# https://www.elastic.co/guide/en/beats/filebeat/index.html


#=================== Filebeat prospectors ========================


filebeat.prospectors:


# Each - is a prospector. Most options can be set at the prospector level, so

# you can use different prospectors for various configurations.

# Below are the prospector specific configurations.


- input_type: log


  # Paths that should be crawled and fetched. Glob based paths.

  paths:

    - /home/admin/helloworld/logs/*.log

    #- c:programdataelasticsearchlogs*


  # Exclude lines. A list of regular expressions to match. It drops the lines that are

  # matching any regular expression from the list.

  #exclude_lines: ["^DBG"]


  # Include lines. A list of regular expressions to match. It exports the lines that are

  # matching any regular expression from the list.

  #include_lines: ["^ERR", "^WARN"]


  # Exclude files. A list of regular expressions to match. Filebeat drops the files that

  # are matching any regular expression from the list. By default, no files are dropped.

  #exclude_files: [".gz$"]


  # Optional additional fields. These field can be freely picked

  # to add additional information to the crawled log files for filtering

  #fields:

  #  level: debug

  #  review: 1


  ### Multiline options


  # Mutiline can be used for log messages spanning multiple lines. This is common

  # for Java Stack Traces or C-Line Continuation


  # The regexp Pattern that has to be matched. The example pattern matches all lines starting with [

  #multiline.pattern: ^[


  # Defines if the pattern set under pattern should be negated or not. Default is false.

  #multiline.negate: false


  # Match can be set to "after" or "before". It is used to define if lines should be append to a pattern

  # that was (not) matched before or after or as long as a pattern is not matched based on negate.

  # Note: After is the equivalent to previous and before is the equivalent to to next in Logstash

  #multiline.match: after


#======================== General ============================


# The name of the shipper that publishes the network data. It can be used to group

# all the transactions sent by a single shipper in the web interface.

#name:


# The tags of the shipper are included in their own field with each

# transaction published.

#tags: ["service-X", "web-tier"]


# Optional fields that you can specify to add additional information to the

# output.

#fields:

#  env: staging


#========================= Outputs ===========================


# Configure what outputs to use when sending the data collected by the beat.

# Multiple outputs may be used.


#----------------------------- Elasticsearch output ------------------------------

#output.elasticsearch:

  # Array of hosts to connect to.

  # hosts: ["localhost:9200"]


  # Optional protocol and basic auth credentials.

  #protocol: "https"

  #username: "elastic"

  #password: "changeme"


#----------------------------- Logstash output --------------------------------

output.logstash:

# The Logstash hosts

  hosts: ["192.168.80.18:5044"]

#加密传输

  ssl.certificate_authorities: ["/usr/local/filebeat-5.6.10/pki/tls/certs/logstash.crt"]

  ssl.certificate: "/usr/local/filebeat-5.6.10/pki/tls/certs/filebeat.crt"

  ssl.key: "/usr/local/filebeat-5.6.10/pki/tls/private/filebeat.key"


#----------------------------- kafka  output-----------------------------------

#output.kafka:

#  hosts: ["192.168.80.42:9092"]

#  topic: test

#  required_acks: 1


  # Optional SSL. By default is off.

  # List of root certificates for HTTPS server verifications

  #ssl.certificate_authorities: ["/etc/pki/root/ca.pem"]


  # Certificate for SSL client authentication

  #ssl.certificate: "/etc/pki/client/cert.pem"


  # Client Certificate Key

  #ssl.key: "/etc/pki/client/cert.key"


#========================== Logging =========================


# Sets log level. The default log level is info.

# Available log levels are: critical, error, warning, info, debug

#logging.level: debug


# At debug level, you can selectively enable logging only for some components.

# To enable all selectors use ["*"]. Examples of other selectors are "beat",

# "publish", "service".

#logging.selectors: ["*"]
七、logstash(非filebeat)进行文件采集,输出到kafka缓存,读取kafka数据并处理输出到文件或es
读数据:
kafkaput.conf:
input {

    file {

        path => [

            # 这里填写需要监控的文件

            "/home/admin/helloworld/logs/catalina.out"

        ]

    }

}


output {

    kafka {

    # 输出到控制台

    # stdout { }

    # 输出到kafka

    bootstrap_servers => "192.168.80.42:9092"

    topic_id          => "test"

    }

}
取数据
indexer.conf
input{

#从redis读取

 redis {

        host => "192.168.80.32"   # redis主机地址

        port => 6379              # redis端口号

       password  => "123456"      # redis 密码

        #db => 8                   # redis数据库编号

        data_type => "channel"    # 使用发布/订阅模式

        key => "logstash_list_0"  # 发布通道名称

}

#从kafka读取

 kafka {

        bootstrap_servers => "192.168.80.42:9092"

           topics          => ["test"]

        auto_offset_reset => "earliest"

       }

}


output {

    #输出到文件

    file {

        path => "/usr/local/logstash-5.6.10/data/log/logstash/all1.log" # 指定写入文件路径

#       message_format => "%{host} %{message}"         # 指定写入格式

        flush_interval => 0                             # 指定刷新间隔,0代表实时写入

     codec => json

       }

   #输出到es

   elasticsearch {

       hosts => "node18:9200"

       codec => json

       }

}
logstash同步mysql数据库数据到es
mysql2es.conf:
input {

 stdin { }

    jdbc {

        jdbc_connection_string => "jdbc:mysql://192.168.80.18:3306/fyyq-mysql"

        jdbc_user => "fyyq"

        jdbc_password => "fyyq@2017"

   jdbc_driver_library => "/usr/local/logstash-5.6.10/mysql-connector-java-5.1.46.jar"

        jdbc_driver_class => "com.mysql.jdbc.Driver"

        jdbc_paging_enabled => "true"

        statement_filepath => "/usr/local/logstash-5.6.10/mysql2es.sql"

        #schedule => "* * * * *"

    }

 }


 output {

     stdout {

        codec => json_lines

    }

    elasticsearch {

        hosts => "node18:9200"

        #index => "mainIndex"

        #document_type => "user"

        #document_id => "%{id}"

    }

}
mysql2es.sql:
select * from sys_log;
logstash输出到hdfs文件**
input {

    beats {

      port => 5044

      #codec => "json"

      ssl => true

   ssl_certificate_authorities => ["/usr/local/logstash-5.6.10/pki/tls/certs/filebeat.crt"]

      ssl_certificate => "/usr/local/logstash-5.6.10/pki/tls/certs/logstash.crt"

      ssl_key => "/usr/local/logstash-5.6.10/pki/tls/private/logstash.key"

      ssl_verify_mode => "force_peer"

                           }

}


filter{

   grok {

       match => { "message" => "%{IP:client} %{WORD:method} %{URIPATHPARAM:request} %{NUMBER:bytes} %{NUMBER:duration}"}

}

}


output {

    # 输出到控制台

    # stdout { }


    # 输出到redis

    redis {

        host => "192.168.80.32"   # redis主机地址

        port => 6379              # redis端口号

        password => "123456"          # redis 密码

       #db => 8                   # redis数据库编号

        data_type => "channel"    # 使用发布/订阅模式

        key => "logstash_list_0"  # 发布通道名称

    }

    #输出到kafka

    kafka {

        bootstrap_servers => "192.168.80.42:9092"

        topic_id          => "test"

                           }

    #输出到es

    elasticsearch {

                           hosts => "node18:9200"

                           codec => json

                           }

    #输出到hdfs

     webhdfs {

     host => "192.168.80.42"

     port => 50070

     path => "/user/logstash/dt=%{+YYYY-MM-dd}/%{@source_host}-%{+HH}.log"

     user => "hadoop"

       }

}
Logstash-input插件及插件参数概览
仅以beat插件为例,后续插件将以连接形式提供(都是官网标准介绍)
所有输入插件都支持以下配置选项:
| Setting | Input type | Required |
|---|---|---|
add_field |
hash | No(默认为{}) |
codec |
codec | No(输入数据的编解码器,默认“plain”) |
enable_metric |
boolean | No(默认true) |
id |
string | No(自动生成,但最好自行定义) |
tags |
array | No |
type |
string | No |
codec:可选
json: (json格式编解码器)
**msgpack: ** (msgpack格式编解码器)
plain: (文本格式编解码器)
multiline: (将多行文本event合并成一个event,eg:将java中的异常跟踪日志合并成一条消息)]**
常用输入插件:
1、beat-input:Receives events from the Elastic Beats framework,从框架接收事件
Settings:
| Setting | Input type | Required |
|---|---|---|
cipher_suites |
array | No |
client_inactivity_timeout |
number | No |
host |
string | No |
include_codec_tag |
boolean | No |
port |
number | Yes(必填项) |
ssl |
boolean | No |
ssl_certificate |
a valid filesystem path | No |
ssl_certificate_authorities |
array | No |
ssl_handshake_timeout |
number | No |
ssl_key |
a valid filesystem path | No |
ssl_key_passphrase |
password | No |
ssl_verify_mode |
string,one of ["none", "peer","force_peer"] |
No |
tls_max_version |
number | No |
tls_min_version |
number |
2、file-input:来自文件的Streams事件(path字段必填项)
https://www.elastic.co/guide/en/logstash/current/plugins-inputs-file.html
3、stdin-input:从标准输入读取事件
https://www.elastic.co/guide/en/logstash/current/plugins-inputs-stdin.html
4、syslog-input:将syslog消息作为事件读取
https://www.elastic.co/guide/en/logstash/current/plugins-inputs-syslog.html
5、tcp-input:从TCP读取事件(port字段必填项)
https://www.elastic.co/guide/en/logstash/current/plugins-inputs-tcp.html
6、udp-input:通过UDP读取事件(port字段必填项)
https://www.elastic.co/guide/en/logstash/current/plugins-inputs-udp.html
7、twitter-input:从Twitter Streaming API读取事件(相对常用场景)
https://www.elastic.co/guide/en/logstash/current/plugins-inputs-twitter.html
(consumer_key、consumer_secret、oauth_token、oauth_token_secret必填项)
8、redis-input:从Redis实例读取事件
https://www.elastic.co/guide/en/logstash/current/plugins-inputs-redis.html
(data_type["list", "channel", "pattern_channel"]、key必填项,)
9、kafka-input:从Kafka主题中读取事件
https://www.elastic.co/guide/en/logstash/current/plugins-inputs-kafka.html
(参数过多,自行查看)
10、jdbc-input:从JDBC数据创建事件
https://www.elastic.co/guide/en/logstash/current/plugins-inputs-jdbc.html
(jdbc_connection_string、jdbc_driver_class、jdbc_user必填项)
11、http-input:通过HTTP或HTTPS接收事件
https://www.elastic.co/guide/en/logstash/current/plugins-inputs-http.html
12、elasticsearch-input:从Elasticsearch集群读取查询结果
https://www.elastic.co/guide/en/logstash/current/plugins-inputs-elasticsearch.html
13、exec-input:将shell命令的输出捕获为事件(command字段必填项)
https://www.elastic.co/guide/en/logstash/current/plugins-inputs-exec.html
非 常用输入插件:
自行进入logstash的插件中心进行查看,有需要自行配置
总:https://www.elastic.co/guide/en/logstash/current/input-plugins.html
Logstash-filter插件(grok)及插件参数概览
所有处理插件均支持的配置:
| Setting | Input type | Required |
|---|---|---|
add_field |
hash | no |
add_tag |
array | no |
enable_metric |
boolean | no |
id |
string | no |
periodic_flush |
boolean | no |
remove_field |
array | no |
remove_tag |
array | no |
常用处理插件:
1、 grok-filter:可以将非结构化日志数据解析为结构化和可查询的内容
https://www.elastic.co/guide/en/logstash/current/plugins-filters-grok.html#_grok_basics
grok模式的语法是 %{SYNTAX:SEMANTIC}
SYNTAX是与您的文本匹配的模式的名称
SEMANTIC是您为匹配的文本提供的标识符
grok是通过系统预定义的正则表达式或者通过自己定义正则表达式来匹配日志中的各个值
正则解析式比较容易出错,建议先调试(地址):
grok debugger调试:http://grokdebug.herokuapp.com/
grok事先已经预定义好了许多正则表达式规则,该规则文件存放路径:
/usr/local/logstash-5.6.10/vendor/bundle/jruby/1.9/gems/logstash-patterns-core-4.1.2/patterns
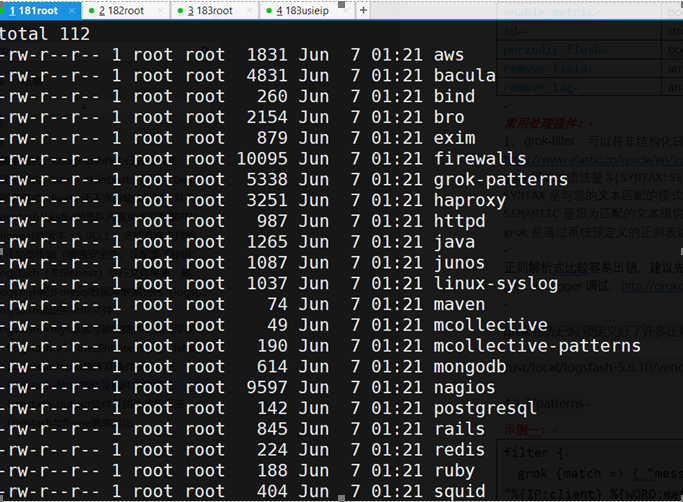
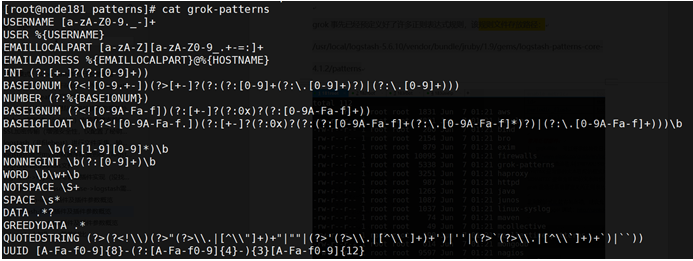
等等,可自行进入查看
示例一:
filter {

  grok {match => { "message" => "%{IP:client} %{WORD:method} %{URIPATHPARAM:request} %{NUMBER:bytes} %{NUMBER:duration}" }

  }

}
初始输入的message是:
55.3.244.1 GET /index.html 15824 0.043
经过grok的正则分析后:
client: 55.3.244.1(IP)

method: GET(方法)

request: /index.html(请求文件路径)

bytes: 15824(字节数)

duration: 0.043(访问时长)
示例二:
filter {

    grok {

        match => { "message" => "%{COMBINEDAPACHELOG}"}

    }

}
COMBINEDAPACHELOG的具体内容见:
https://github.com/logstash-plugins/logstash-patterns-core/blob/master/patterns/httpd
初始输入message为:
192.168.80.183 - - [04/Jan/2018:05:13:42 +0000] "GET /presentations/logstash-monitorama-2013/images/kibana-search.png HTTP/1.1" 200 203023 "http://semicomplete.com/presentations/logstash-monitorama-2013/" "Mozilla/5.0 (Macintosh; Intel Mac OS X 10_9_1) AppleWebKit/537.36 (KHTML, like Gecko) Chrome/32.0.1700.77 Safari/537.36"
经过grok正则分析后:
"clientip" => "192.168.80.183",

"timestamp" => "04/Jan/2018:05:13:42 +0000",

"verb" => "GET",

"request" => "/presentations/logstash-monitorama-2013/images/kibana-search.png",

"referrer" => ""http://semicomplete.com/presentations/logstash-monitorama-2013/"",

"response" => "200",

"bytes" => "203023",

"agent" => ""Mozilla/5.0 (Macintosh; Intel Mac OS X 10_9_1) AppleWebKit/537.36 (KHTML, like Gecko) Chrome/32.0.1700.77 Safari/537.36"",
示例三(自定义grok表达式mypattern[A-Z]):
filter {

  grok{
  match=>{
    "message"=>"%{IP:clientip}s+(?<mypattern>[A-Z]+)"}
    }

}
初始输入message:
12.12.12.12 ABC
经过grok正则分析后:
"clientip" => "12.12.12.12",
"mypattern" => "ABC"
示例四(移除重复字段):
filter {

    grok {

        #match => { "message" => "%{COMBINEDAPACHELOG}"}

         match => { "message" => "%{IP:clientip}s+%{IP:clientip1}"}

    }

    mutate {

    remove_field => ["message"]

    remove_field => ["host"]

   }

}
初始输入message:
1.1.1.1 2.2.2.2
经过grok正则解析后(json格式):
{

  "_index": "logstash-2018.07.31",

  "_type": "log",

  "_id": "AWTuNdzp6Wkp4mVEj3Fh",

  "_version": 1,

  "_score": null,

  "_source": {

    "@timestamp": "2018-07-31T02:41:00.014Z",

    "offset": 1114,

    "clientip": "1.1.1.1",

    "@version": "1",

    "input_type": "log",

    "beat": {

      "name": "node183",

      "hostname": "node183",

      "version": "5.6.10"

    },

    "source": "/home/usieip/bdp-datashare/logs/a.log",

    "type": "log",

    "clientip1": "2.2.2.2",

    "tags": [

      "beats_input_codec_plain_applied"

    ]

  },

  "fields": {

    "@timestamp": [

      1533004860014

    ]

  },

  "sort": [

    1533004860014

  ]

}
示例五(过滤筛选catalina.out文件中的信息,message字段已移除):
filter {

    grok {

         match => { "message" =>

 "%{DATA:ymd} %{DATA:sfm} %{DATA:http} %{DATA:info}  %{GREEDYDATA:index}"}

}

}
Data在pattern中的定义是:.*? GREEDYDATA在pattern中的定义是:.*】
初始输入message:
2018-07-30 17:04:31.317 [http-bio-8080-exec-19] INFO c.u.i.b.m.s.i.LogInterceptor - ViewName: modules/datashare/front/index
经过grok正则解析后(截图及json格式如下):
{

  "_index": "logstash-2018.07.31",

  "_type": "log",

  "_id": "AWTvhiPD6Wkp4mVEj3GU",

  "_version": 1,

  "_score": null,

  "_source": {

    "offset": 125,

    "input_type": "log",

    "index": "c.u.i.b.m.s.i.LogInterceptor - ViewName: modules/datashare/front/index",

    "source": "/home/usieip/bdp-datashare/logs/b.log",

    "type": "log",

    "tags": [],

    "ymd": "2018-07-30",

    "@timestamp": "2018-07-31T08:48:17.948Z",

    "@version": "1",

    "beat": {

      "name": "node183",

      "hostname": "node183",

      "version": "5.6.10"

    },

    "http": "[http-bio-8080-exec-19]",

    "sfm": "17:04:31.317",

    "info": "INFO"

  },

  "fields": {

    "ymd": [

      1532908800000

    ],

    "@timestamp": [

      1533026897948

    ]

  },

  "sort": [

    1533026897948

  ]

}
*常用参数:*
1)match:match作用:用来对字段的模式进行匹配
2)patterns_dir:用来指定规则的匹配路径,如果使用logstash自定义的规则时,不需要写此参数。Patterns_dir可以同时制定多个存放过滤规则的目录;
patterns_dir => ["/opt/logstash/patterns","/opt/logstash/extra_patterns"]
3)remove_field:如果匹配到某个”日志字段,则将匹配的这个日志字段从这条日志中删除(多个以逗号隔开)
remove_field => ["foo _%{somefield}"]
-
clone-filter:克隆过滤器用于复制事件
-
drop-filter:丢弃所有活动
-
json-filter:解析JSON事件
-
kv-filter:解析键值对
非常用参数:
参考教程:https://www.elastic.co/guide/en/logstash/current/filter-plugins.html
Logstash-output插件及插件参数概览
所有输出插件均支持以下配置:
| Setting | Input type | Required |
|---|---|---|
codec |
codec | No(默认plain) |
enable_metric |
boolean | No(默认true) |
id |
string | No |
常用插件:
1、Elasticsearch-output:此插件是在Elasticsearch中存储日志的推荐方法。如果您打算使用Kibana Web界面,则需要使用此输出
2、file-output:此输出将事件写入磁盘上的文件(path字段必填项)
3、kafka-output:将事件写入Kafka主题(topic_id是必填项)
4、 redis-output:此输出将使用RPUSH将事件发送到Redis队列
5、stdout-output:一个简单的输出,打印到运行Logstash的shell的STDOUT
*非常用插件:*
参考官网教程链接:https://www.elastic.co/guide/en/logstash/current/output-plugins.html
Logstash与flume简单对比
1)结构:
Logstash: Shipper、Broker、Indexer (broker部署redis或者kafka进行缓存)
Flume: Source、Channel、Sink
Logstash已集成,broker可以不需要,直接读取处理输出,不进行缓存
Flume需单独配置,三组件缺一不可
2)配置:
Logstash:配置简洁清晰,三个部分的属性都定义好了,可自行选择,若没有,可自行开发插件,便捷易用;且logstash在Filter plugin部分具有比较完备的功能,比如grok,能通过正则解析和结构化任何文本,Grok 目前是Logstash最好的方式对非结构化日志数据解析成结构化和可查询化。此外,Logstash还可以重命名、删除、替换和修改事件字段,当然也包括完全丢弃事件,如debug事件。还有很多的复杂功能可供选择,
Flume:配置繁琐,分别手动配置source、channel、sink,采集环境如果复杂需要多个。Flume的插件比较多,channel常用的就内存和文件两种
3)初衷:
Flume侧重数据的传输,使用者需非常清楚整个数据的路由,相对来说其更可靠,channel是用于持久化目的的,数据必须确认传输到下一个目的地,才会删除;
Logstash侧重数据的预处理,日志字段经过预处理之后再进行解析
4)组件:
logstash可以与elk其他组件配合使用、开发,应用简单,使用场景广泛;
flume新版本轻量级,适合有一定计算编程基础的人使用,且场景针对性强,需要配合很多其他工具进行使用,不方便
5)举例:
Logstash:主板、电源、硬盘,机箱等都已经装好的台式机,可以直接用
Flume :提供一套完整的主板,电源、硬盘、机箱等,自行组装,装好了才能用