2018-07-24 15:36:43 起 -
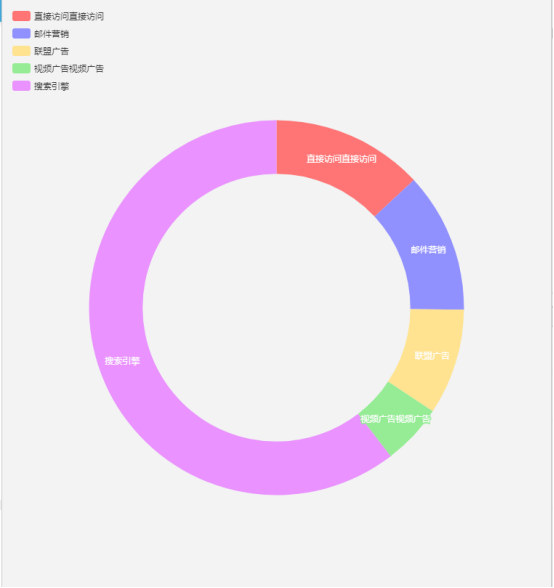
饼图单项不同颜色的设置
效果图:
实现:
说明:
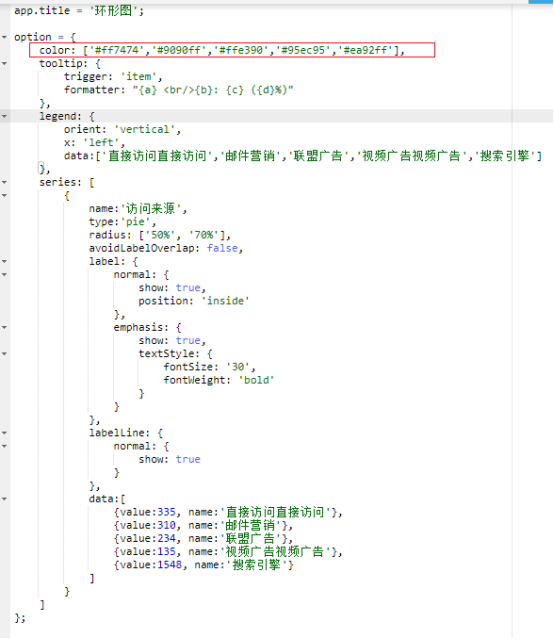
其实很简单,就是设置全局的color属性即可。color属性可以是一套数组,里边的样式以字符串格式设置。
设置以后饼图每一项会依照顺序使用数组的颜色值,如果不够用会循环使用。
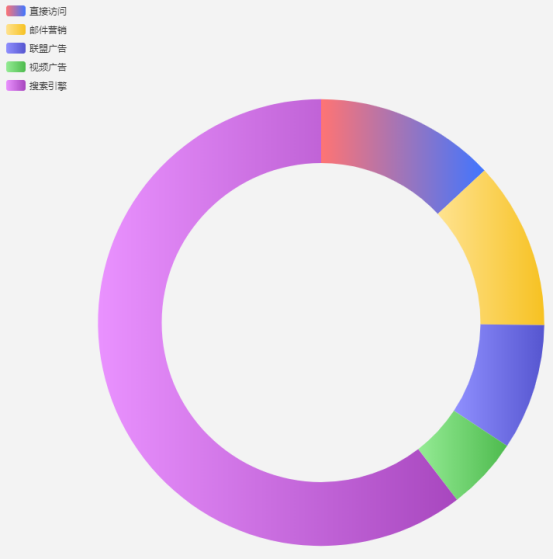
饼图每个单项的渐变效果
效果图:
实现:
说明:
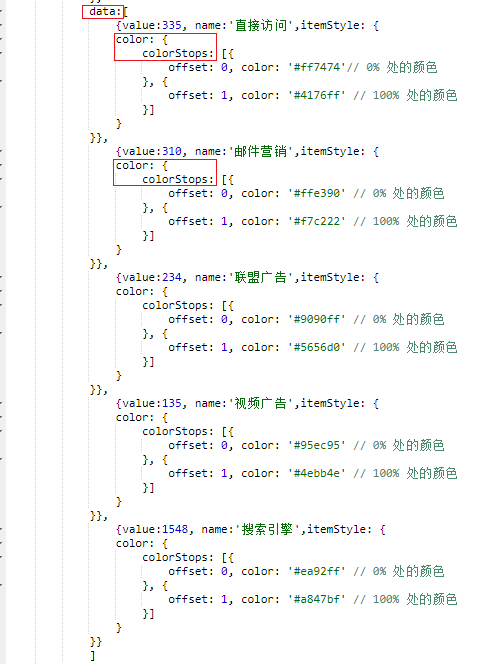
data数据可以是一个数组,数组每一项是一个对象,对象里边可以再次设置私有属性以覆盖全局属性,比如color。
所以对每一个单项设置渐变色,就在data数组的每一个对象中单独设置color即可。
代码:
data: [
    {
        value: 335,
        name: '直接访问',
        itemStyle: {
            color: {
                colorStops: [{
                        offset: 0,
                        color: '#ff7474 ' // 0% 处的颜色
                    }, {
                        offset: 1,
                        color: '#4176ff' // 100% 处的颜色
                    }]
            }
        }
    },
    {
        value: 310,
        name: '邮件营销',
        itemStyle: {
            color: {
                colorStops: [{
                        offset: 0,
                        color: '#ffe390' // 0% 处的颜色
                    }, {
                        offset: 1,
                        color: '#f7c222' // 100% 处的颜色
                    }]
            }
        }
    },
    {
        value: 234,
        name: '联盟广告',
        itemStyle: {
            color: {
                colorStops: [{
                        offset: 0,
                        color: '#9090ff' // 0% 处的颜色
                    }, {
                        offset: 1,
                        color: '#5656d0' // 100% 处的颜色
                    }]
            }
        }
    },
    {
        value: 135,
        name: '视频广告',
        itemStyle: {
            color: {
                colorStops: [{
                        offset: 0,
                        color: '#95ec95' // 0% 处的颜色
                    }, {
                        offset: 1,
                        color: '#4ebb4e' // 100% 处的颜色
                    }]
            }
        }
    },
    {
        value: 1548,
        name: '搜索引擎',
        itemStyle: {
            color: {
                colorStops: [{
                        offset: 0,
                        color: '#ea92ff' // 0% 处的颜色
                    }, {
                        offset: 1,
                        color: '#a847bf' // 100% 处的颜色
                    }]
            }
        }
    }
]
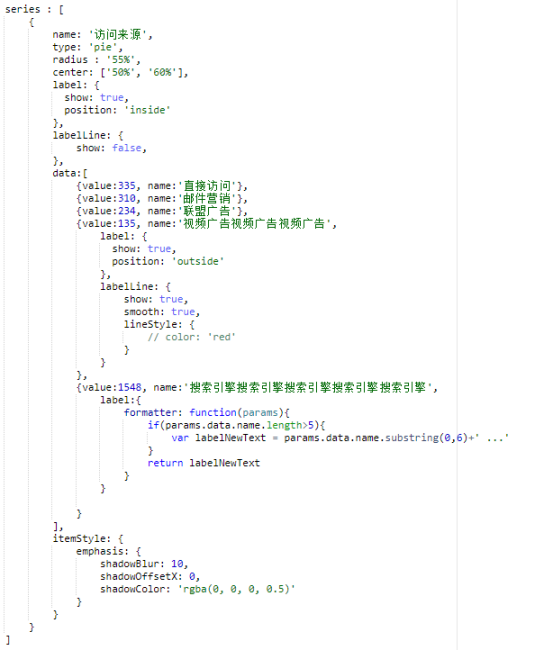
饼图label固定字数,超出的限制为显示”...”
效果图:
实现:
见另一篇文章总结比较清晰明了:https://www.cnblogs.com/padding1015/p/8625168.html
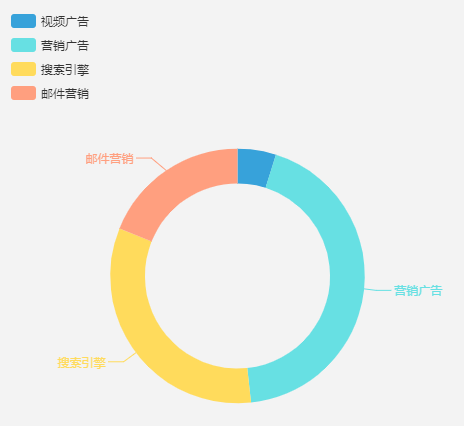
饼图根据单项数据大小设置文案的展示状态(是否探出等)
效果图:
实现:

说明:
同颜色的道理一样,data数组里边的每一项还有很多可以设置的属性,包括label是否展示等。
所以在拿到数据以后,遍历返回的data每一项的value值,如果小于自己的需求范围,就在这一项上边设置label不展示的代码即可。
代码:
data: [{
        value: 35,
        name: '视频广告',
        labelLine: {
            normal: {
                show: false
            }
        },
        label: {
            normal: {
                show: false
            }
        }
    }, {
        value: 315,
        name: '邮件营销'
    }
]
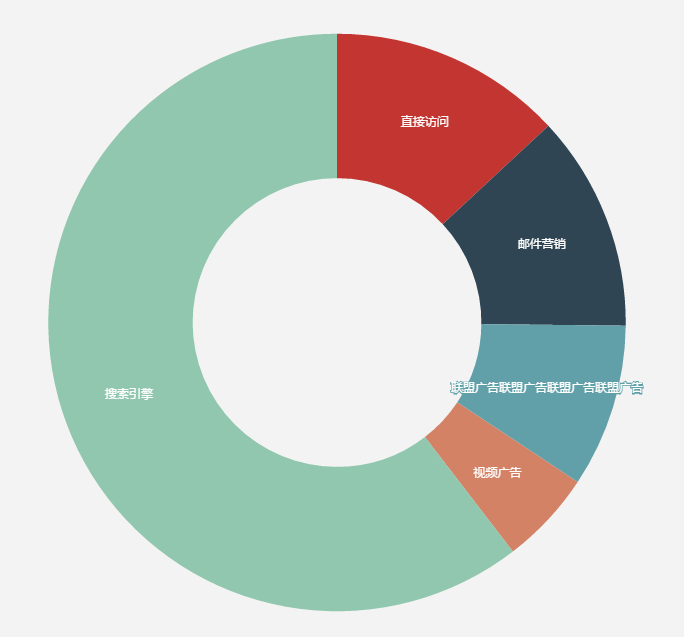
饼图展示标签在外边或在里边
效果图:

实现:
说明:
默认设置全部都不探出,只在内部显示,而只要data某一项中value值符合条件就对此项单独设置为label探出效果即可。
代码:
option = {
    title: {
        text: '某站点用户访问来源',
        subtext: '纯属虚构',
        x: 'center'
    },
    tooltip: {
        trigger: 'item',
        formatter: "{a} <br/>{b} : {c} ({d}%)"
    },
    legend: {
        orient: 'vertical',
        left: 'left',
        data: ['直接访问', '邮件营销', '联盟广告', '视频广告', '搜索引擎']
    },
    series: [{
            name: '访问来源',
            type: 'pie',
            radius: '55%',
            center: ['50%', '60%'],
            label: {
                show: true,
                position: 'inside'
            },
            labelLine: {
                show: false,
            },
            data: [{
                    value: 335,
                    name: '直接访问'
                }, {
                    value: 310,
                    name: '邮件营销'
                }, {
                    value: 234,
                    name: '联盟广告'
                }, {
                    value: 135,
                    name: '视频广告视频广告视频广告',
                    label: {
                        show: true,
                        position: 'outside'
                    },
                    labelLine: {
                        show: true,
                        smooth: true,
                        lineStyle: {
                           // color: 'red'
                        }
                    }
                }, {
                    value: 1548,
                    name: '搜索引擎搜索引擎搜索引擎搜索引擎搜索引擎',
                    label: {
                        formatter: function (params) {
                            if (params.data.name.length > 5) {
                                var labelNewText = params.data.name.substring(0, 6) + ' ...'
                            }
                            return labelNewText
                        }
                    }
                }],
            itemStyle: {
                emphasis: {
                    shadowBlur: 10,
                    shadowOffsetX: 0,
                    shadowColor: 'rgba(0, 0, 0, 0.5)'
                }
            }
        }]
};