题目太长了!下载地址【传送门】
第1题
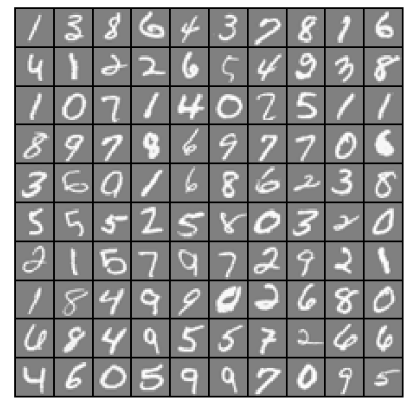
简述:识别图片上的数字。
  1 import numpy as np
  2 import scipy.io as scio
  3 import matplotlib.pyplot as plt
  4 import scipy.optimize as op
  5
  6 #显示图片数据
  7 def displayData(X):
  8     m = np.size(X, 0)  #X的行数,即样本数量
  9     n = np.size(X, 1)  #X的列数,即单个样本大小
 10     example_width = int(np.round(np.sqrt(n)))  #单张图片宽度
 11     example_height = int(np.floor(n / example_width))  #单张图片高度
 12     display_rows = int(np.floor(np.sqrt(m)))  #显示图中,一行多少张图
 13     display_cols = int(np.ceil(m / display_rows))  #显示图中,一列多少张图片
 14     pad = 1  #图片间的间隔
 15     display_array = - np.ones((pad + display_rows * (example_height + pad),
 16                             pad + display_cols * (example_width + pad)))  #初始化图片矩阵
 17     curr_ex = 0  #当前的图片计数
 18     #将每张小图插入图片数组中
 19     for j in range(0, display_rows):
 20         for i in range(0, display_cols):
 21             if curr_ex >= m:
 22                 break
 23             max_val = np.max(abs(X[curr_ex, :]))
 24             jstart = pad + j * (example_height + pad)
 25             istart = pad + i * (example_width + pad)
 26             display_array[jstart: (jstart + example_height), istart: (istart + example_width)] =
 27                 np.array(X[curr_ex, :]).reshape(example_height, example_width) / max_val
 28             curr_ex = curr_ex + 1
 29         if curr_ex >= m:
 30             break
 31     display_array = display_array.T
 32     plt.imshow(display_array,cmap=plt.cm.gray)
 33     plt.axis('off')
 34     plt.show()
 35
 36 #计算hθ(z)
 37 def sigmoid(z):
 38     g = 1.0 / (1.0 + np.exp(-z))
 39     return g
 40
 41 #计算cost
 42 def lrCostFunction(theta, X, y, lamb):
 43     theta = np.array(theta).reshape((np.size(theta), 1))
 44     m = np.size(y)
 45     h = sigmoid(np.dot(X, theta))
 46     J = 1 / m * (-np.dot(y.T, np.log(h)) - np.dot((1 - y.T), np.log(1 - h)))
 47     theta2 = theta[1:, 0]
 48     Jadd = lamb / (2 * m) * np.sum(theta2 ** 2)
 49     J = J + Jadd
 50     return J.flatten()
 51
 52 #计算梯度
 53 def gradient(theta, X, y, lamb):
 54     theta = np.array(theta).reshape((np.size(theta), 1))
 55     m = np.size(y)
 56     h = sigmoid(np.dot(X, theta))
 57     grad = 1/m*np.dot(X.T, h - y)
 58     theta[0,0] = 0
 59     gradadd = lamb/m*theta
 60     grad = grad + gradadd
 61     return grad.flatten()
 62
 63 #θ计算
 64 def oneVsAll(X, y, num_labels, lamb):
 65     m = np.size(X, 0)
 66     n = np.size(X, 1)
 67     all_theta = np.zeros((num_labels, n+1))
 68     one = np.ones(m)
 69     X = np.insert(X, 0, values=one, axis=1)
 70     for c in range(0, num_labels):
 71         initial_theta = np.zeros(n+1)
 72         y_t = (y==c)
 73         result = op.minimize(fun=lrCostFunction, x0=initial_theta, args=(X, y_t, lamb), method='TNC', jac=gradient)
 74         all_theta[c, :] = result.x
 75     return all_theta
 76
 77 #计算准确率
 78 def predictOneVsAll(all_theta, X):
 79     m = np.size(X, 0)
 80     num_labels = np.size(all_theta, 0)
 81     p = np.zeros((m, 1))  #用来保存每行的最大值
 82     g = np.zeros((np.size(X, 0), num_labels))  #用来保存每次分类后的结果(一共分类了10次,每次保存到一列上)
 83     one = np.ones(m)
 84     X = np.insert(X, 0, values=one, axis=1)
 85     for c in range(0, num_labels):
 86         theta = all_theta[c, :]
 87         g[:, c] = sigmoid(np.dot(X, theta.T))
 88     p = g.argmax(axis=1)
 89     # print(p)
 90     return p.flatten()
 91
 92 #加载数据文件
 93 data = scio.loadmat('ex3data1.mat')
 94 X = data['X']
 95 y = data['y']
 96 y = y%10  #因为数据集是考虑了matlab从1开始,把0的结果保存为了10,这里进行取余,将10变回0
 97 m = np.size(X, 0)
 98 rand_indices = np.random.randint(0,m,100)
 99 sel = X[rand_indices, :]
100 displayData(sel)
101
102 #计算θ
103 lamb = 0.1
104 num_labels = 10
105 all_theta = oneVsAll(X, y, num_labels, lamb)
106 # print(all_theta)
107
108 #计算预测的准确性
109 pred = predictOneVsAll(all_theta, X)
110 # np.set_printoptions(threshold=np.inf)
111 #在计算这个上遇到了一个坑:
112 #pred输出的是[[...]]的形式,需要flatten变成1维向量,y同样用flatten变成1维向量
113 acc = np.mean(pred == y.flatten())*100
114 print('Training Set Accuracy:',acc,'%')
运行结果:
![]()
第2题
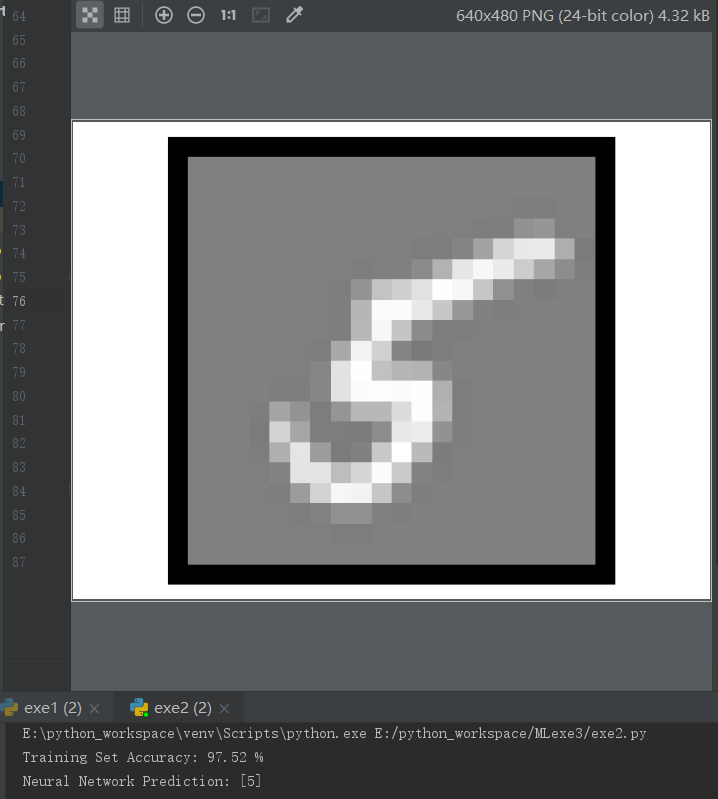
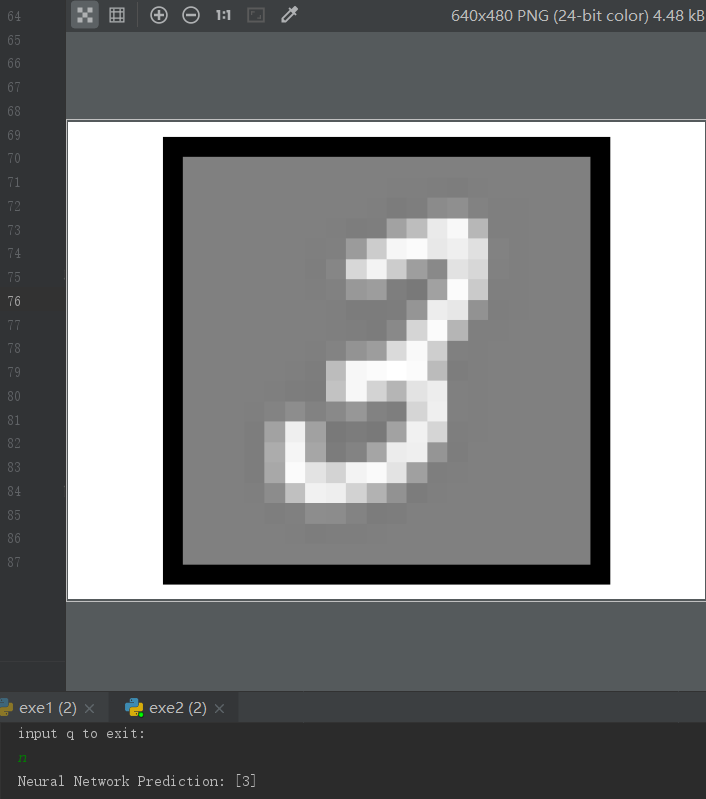
简介:使用神经网络实现数字识别(Θ已提供)
 1 import numpy as np
 2 import scipy.io as scio
 3 import matplotlib.pyplot as plt
 4 import scipy.optimize as op
 5
 6 #显示图片数据
 7 def displayData(X):
 8     m = np.size(X, 0)  #X的行数,即样本数量
 9     n = np.size(X, 1)  #X的列数,即单个样本大小
10     example_width = int(np.round(np.sqrt(n)))  #单张图片宽度
11     example_height = int(np.floor(n / example_width))  #单张图片高度
12     display_rows = int(np.floor(np.sqrt(m)))  #显示图中,一行多少张图
13     display_cols = int(np.ceil(m / display_rows))  #显示图中,一列多少张图片
14     pad = 1  #图片间的间隔
15     display_array = - np.ones((pad + display_rows * (example_height + pad),
16                             pad + display_cols * (example_width + pad)))  #初始化图片矩阵
17     curr_ex = 0  #当前的图片计数
18     #将每张小图插入图片数组中
19     for j in range(0, display_rows):
20         for i in range(0, display_cols):
21             if curr_ex >= m:
22                 break
23             max_val = np.max(abs(X[curr_ex, :]))
24             jstart = pad + j * (example_height + pad)
25             istart = pad + i * (example_width + pad)
26             display_array[jstart: (jstart + example_height), istart: (istart + example_width)] =
27                 np.array(X[curr_ex, :]).reshape(example_height, example_width) / max_val
28             curr_ex = curr_ex + 1
29         if curr_ex >= m:
30             break
31     display_array = display_array.T
32     plt.imshow(display_array,cmap=plt.cm.gray)
33     plt.axis('off')
34     plt.show()
35
36 #计算hθ(z)
37 def sigmoid(z):
38     g = 1.0 / (1.0 + np.exp(-z))
39     return g
40
41 #实现神经网络
42 def predict(theta1, theta2, X):
43     m = np.size(X,0)
44     p = np.zeros((np.size(X, 0), 1))
45     #第二层计算
46     one = np.ones(m)
47     X = np.insert(X, 0, values=one, axis=1)
48     a2 = sigmoid(np.dot(X, theta1.T))
49     #第三层计算
50     one = np.ones(np.size(a2,0))
51     a2 = np.insert(a2, 0, values=one, axis=1)
52     a3 = sigmoid(np.dot(a2, theta2.T))
53     p = a3.argmax(axis=1) + 1  #y的值为1-10,所以此处0-9要加1
54     return p.flatten()
55
56 #读取数据文件
57 data = scio.loadmat('ex3data1.mat')
58 X = data['X']
59 y = data['y']
60 m = np.size(X, 0)
61 rand_indices = np.random.randint(0,m,100)
62 sel = X[rand_indices, :]
63 # displayData(sel)
64
65 theta = scio.loadmat('ex3weights.mat')
66 theta1 = theta['Theta1']
67 theta2 = theta['Theta2']
68
69 #预测准确率
70 pred = predict(theta1, theta2, X)
71 acc = np.mean(pred == y.flatten())*100
72 print('Training Set Accuracy:',acc,'%')
73
74 #识别单张图片
75 for i in range(0, m):
76     it = np.random.randint(0, m, 1)
77     it = it[0]
78     displayData(X[it:it+1, :])
79     pred = predict(theta1, theta2, X[it:it+1, :])
80     print('Neural Network Prediction:', pred)
81     print('input q to exit:')
82     cin = input()
83     if cin == 'q':
84         break
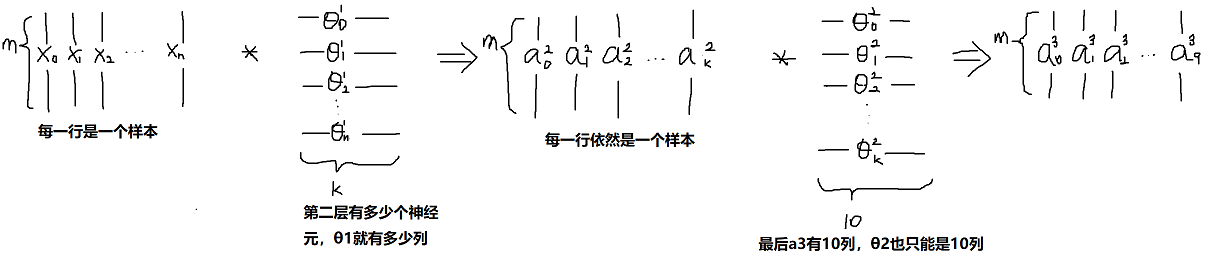
神经网络的矩阵表示分析:
运行结果: