1.matplotlib.patch基本用法
matplotlib.patch对象底层的对象就是Path。它的基本用法如下:
import matplotlib.pyplot as plt
from matplotlib.path import Path
import matplotlib.patches as patches
verts = [
(0., 0.), # left, bottom
(0., 1.), # left, top
(1., 1.), # right, top
(1., 0.), # right, bottom
(0., 0.), # ignored
]
codes = [Path.MOVETO,
Path.LINETO,
Path.LINETO,
Path.LINETO,
Path.CLOSEPOLY,
]
path = Path(verts, codes)
fig = plt.figure()
ax = fig.add_subplot(111)
patch = patches.PathPatch(path)
ax.add_patch(patch)
ax.set_xlim(-2,2)
ax.set_ylim(-2,2)
plt.show()

2.matplotlib.path.Path(verts,codes)
PATH对象的创建通过matplotlib.path.Path(verts,codes)创建
参数:
-
verts:PATH的顶点。这些顶点必须构成一个封闭曲线。其中每个顶点必须指定x坐标和y坐标。 -
codes:指示如何使用这些PATH顶点。它与verts关系是一一对应的。有如下指令:Path.STOP:结束path的标记Path.MOVETO:画笔提起并移动到指定的顶点Path.LINETO:画笔画直线,从current position到指定的顶点Path.CURVE3:画笔画二阶贝塞尔曲线,从current position到指定的end point, 其中还有一个参数是指定的control pointPath.CURVE4:画笔画三阶贝塞尔曲线,从current position到指定的end point, 其中还有两个参数是指定的control pointsPath.CLOSEPOLY:指定的point参数被忽略。该指令画一条线段, 从current point到start point
可以通过matplotlib.patches.PathPatch(path)来构建一个PathPatch对象,然后通过Axes.add_patch(patch)向Axes添加PathPatch对象.这样就添加了Path到图表中。
举例:
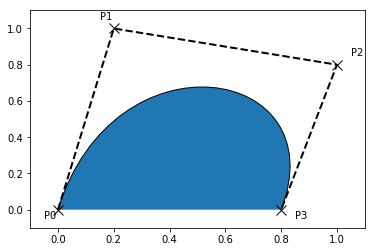
import matplotlib.pyplot as plt
from matplotlib.path import Path
import matplotlib.patches as patches
verts = [
(0., 0.), # P0
(0.2, 1.), # P1
(1., 0.8), # P2
(0.8, 0.), # P3
]
codes = [Path.MOVETO,
Path.CURVE4,
Path.CURVE4,
Path.CURVE4,
]
path = Path(verts, codes)
fig = plt.figure()
ax = fig.add_subplot(111)
patch = patches.PathPatch(path)
ax.add_patch(patch)

xs,ys = zip(*verts)
ax.plot(xs,ys,'x--',lw=2,color='black',ms=10)
ax.text(-0.05,-0.05,'P0')
ax.text(0.15,1.05,'P1')
ax.text(1.05,0.85,'P2')
ax.text(0.85,-0.05,'P3')

ax.set_xlim(-0.1,1.1)
ax.set_ylim(-0.1,1.1)
plt.show()
3.在matplotlib中所有简单的patch primitive,如Rectangle、Circle、Polygon等等,都是由简单的Path来实现的。而创建大量的primitive的函数如hist()和bar()(他们创建了大量的Rectanle)可以使用一个compound path来高效地实现。
但是实际上
bar()创建的是一系列的Rectangle,而没有用到compound path,这是由于历史原因,是历史遗留问题。(bar()函数先于Coupound Path出现)
下面是一个Compound Path的例子:
  ...
  verts = np.zeros((nverts, 2))  # nverts为顶点的个数加1(一个终止符)
  codes = np.ones(nverts, int) * Path.LINETO
  ## 设置 codes :codes分成5个一组,
  ## 每一组以Path.MOVETO开始,后面是3个Path.LINETO,最后是Path.CLOSEPOLY
  codes[0::5] = Path.MOVETO
  codes[4::5] = Path.CLOSEPOLY
  ## 设置顶点 verts ##
  ...
  ## 创建 Path 、PathPatch并添加  ##
  barpath = Path(verts, codes)
  patch = patches.PathPatch(barpath, facecolor='green',edgecolor='yellow', alpha=0.5)
  fig = plt.figure()
  ax = fig.add_subplot(111)
  ax.add_patch(patch)
  ax.show()
在创建Axes或者SubPlot时,可以给构造函数提供一个axisbg参数来指定背景色