1. 字符串转成numpy.datetime64格式
import numpy as np
#将字符串转换成numpy格式时间
#注意个位前补0,如1月写成01
nd=np.datetime64('2019-01-10')
nd
![]()
np.datetime64('1901')
![]()
2. numpy.datetime64转成字符串格式
#转化为字符串
np.datetime_as_string(nd)
![]()
3. np.arange生成时间序列
#生成时间序列
#默认以日为间隔,算头不算尾
np.arange('2019-01-05','2019-01-10',dtype='datetime64')
![]()

import matplotlib.pyplot as plt
plt.rcParams['font.sans-serif']=['SimHei']
plt.rcParams['axes.unicode_minus']=False
#设定随机种子(括号里的数字只是起标记作用)
np.random.seed(1)
#h:小时,m:分,s:秒,ms微秒
#生成分时
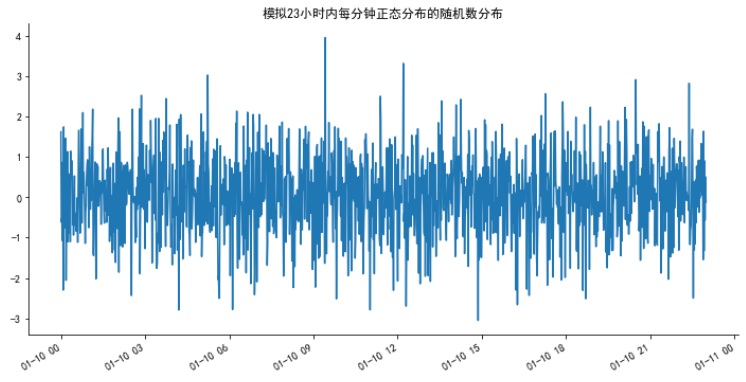
x=np.arange('2019-01-10T00:00:00','2019-01-10T23:00:00',dtype='datetime64[m]')
#生成标准正态分布时间序列
y=np.random.standard_normal(len(x))
#设置图片大小
fig=plt.figure(figsize=(12,6))
#将x的np.datetime转换为datetime.datetime
plt.plot(x.astype(datetime),y)
fig.autofmt_xdate()
plt.title('模拟23小时内每分钟正态分布的随机数分布')
# 将右边 上边的两条边颜色设置为空 其实就相当于抹掉这两条边
ax = plt.gca()
ax.spines['right'].set_color('none')
ax.spines['top'].set_color('none')
plt.show()

参考文献: