实验环境
实验用2到2台机器,实验所用机器系统环境如下,可以看到2台机器的主机名和IP地址
[root@linux-node1 ~]# cat /etc/redhat-release
CentOS Linux release 7.1.1503 (Core)
[root@linux-node1 ~]# cat /etc/hosts
127.0.0.1   localhost localhost.localdomain localhost4 localhost4.localdomain4
::1         localhost localhost.localdomain localhost6 localhost6.localdomain6
192.168.58.11 linux-node1 linux-node1.nmap.com
192.168.58.12 linux-node2 linux-node2.nmap.com
[root@linux-node1 ~]# hostname
linux-node1.nmap.com
[root@linux-node1 ~]#
nginx自带的监控介绍
先学习下nginx自带的的状态监控
以下软件包是编译安装nginx需要的包
[root@linux-node1 ~]# yum install -y glibc gcc-c++ pcre-devel gcc openssl-devel
Loaded plugins: fastestmirror
Loading mirror speeds from cached hostfile
 * base: mirrors.zju.edu.cn
 * epel: mirrors.tuna.tsinghua.edu.cn
 * extras: mirrors.aliyun.com
 * updates: mirrors.aliyun.com
Package glibc-2.17-157.el7_3.1.x86_64 already installed and latest version
Package gcc-c++-4.8.5-11.el7.x86_64 already installed and latest version
Package pcre-devel-8.32-15.el7_2.1.x86_64 already installed and latest version
Package gcc-4.8.5-11.el7.x86_64 already installed and latest version
Package 1:openssl-devel-1.0.1e-60.el7_3.1.x86_64 already installed and latest version
Nothing to do
[root@linux-node1 ~]#
下载nginx稳定版并解压
[root@linux-node1 ~]# cd /usr/local/src/
[root@linux-node1 src]# ls
[root@linux-node1 src]# wget http://nginx.org/download/nginx-1.10.3.tar.gz
--2017-03-19 18:04:23--  http://nginx.org/download/nginx-1.10.3.tar.gz
Resolving nginx.org (nginx.org)... 95.211.80.227, 206.251.255.63
Connecting to nginx.org (nginx.org)|95.211.80.227|:80... connected.
HTTP request sent, awaiting response... 200 OK
Length: 911509 (890K) [application/octet-stream]
Saving to: ‘nginx-1.10.3.tar.gz’

100%[==================================================>] 911,509      303KB/s   in 2.9s

2017-03-19 18:04:27 (303 KB/s) - ‘nginx-1.10.3.tar.gz’ saved [911509/911509]

[root@linux-node1 src]# tar xfz nginx-1.10.3.tar.gz
[root@linux-node1 src]# cd nginx-1.10.3
[root@linux-node1 nginx-1.10.3]#
新建一个用户www,用于以普通用户运行nginx ;配置,生成Makefile文件
[root@linux-node1 nginx-1.10.3]# useradd -s /sbin/nologin -M www
[root@linux-node1 nginx-1.10.3]# ./configure --prefix=/usr/local/nginx-1.10.3
> --user=www --group=www
> --with-http_ssl_module
> --with-http_stub_status_module
配置完毕,pcre是它默认加的,很多人编译使用--with-pcre 其实使用系统的就够了
checking for getaddrinfo() ... found
checking for PCRE library ... found
checking for PCRE JIT support ... found
checking for OpenSSL library ... found
checking for zlib library ... found
creating objs/Makefile

Configuration summary
  + using system PCRE library
  + using system OpenSSL library
  + md5: using OpenSSL library
  + sha1: using OpenSSL library
  + using system zlib library

  nginx path prefix: "/usr/local/nginx-1.10.3"
  nginx binary file: "/usr/local/nginx-1.10.3/sbin/nginx"
  nginx modules path: "/usr/local/nginx-1.10.3/modules"
  nginx configuration prefix: "/usr/local/nginx-1.10.3/conf"
  nginx configuration file: "/usr/local/nginx-1.10.3/conf/nginx.conf"
  nginx pid file: "/usr/local/nginx-1.10.3/logs/nginx.pid"
  nginx error log file: "/usr/local/nginx-1.10.3/logs/error.log"
  nginx http access log file: "/usr/local/nginx-1.10.3/logs/access.log"
  nginx http client request body temporary files: "client_body_temp"
  nginx http proxy temporary files: "proxy_temp"
  nginx http fastcgi temporary files: "fastcgi_temp"
  nginx http uwsgi temporary files: "uwsgi_temp"
  nginx http scgi temporary files: "scgi_temp"

[root@linux-node1 nginx-1.10.3]#
编译和安装
[root@linux-node1 nginx-1.10.3]# make && make install
以上安装完毕,安装结尾部分如下
cp conf/nginx.conf '/usr/local/nginx-1.10.3/conf/nginx.conf.default'
test -d '/usr/local/nginx-1.10.3/logs'
	|| mkdir -p '/usr/local/nginx-1.10.3/logs'
test -d '/usr/local/nginx-1.10.3/logs'
	|| mkdir -p '/usr/local/nginx-1.10.3/logs'
test -d '/usr/local/nginx-1.10.3/html'
	|| cp -R html '/usr/local/nginx-1.10.3'
test -d '/usr/local/nginx-1.10.3/logs'
	|| mkdir -p '/usr/local/nginx-1.10.3/logs'
make[1]: Leaving directory `/usr/local/src/nginx-1.10.3'
[root@linux-node1 nginx-1.10.3]# echo $?
0
[root@linux-node1 nginx-1.10.3]#
做软链接
[root@linux-node1 nginx-1.10.3]# cd
[root@linux-node1 ~]# ln -s /usr/local/nginx-1.10.3/ /usr/local/nginx
[root@linux-node1 ~]#
怎么监控nginx,可以搜索一些做监控的产品他们做的文档,比较好,网站上很多人写的博客其实有的有错误,监控宝这种即使出现错误也不会太大
搜索监控宝的nginx相关的wiki
http://www.jiankongbao.com/search.php?q=nginx

http://wiki.jiankongbao.com/doku.php/%E6%96%87%E6%A1%A3:%E5%AE%89%E5%85%A8%E6%8C%87%E5%BC%95#nginx_监控
需要注意的是,Nginx默认安装不包含状态模块stub_status,所以,在编译Nginx的时候,需要添加以下参数:
--with-http_stub_status_module
一旦包含stub_status模块后,我们就可以在配置文件nginx.conf中开启状态页面:
http {
    server {
        listen       80;
        server_name  localhost;

        location / {
            root   html;
            index  index.html index.htm;
        }

        location /nginx-status {
            stub_status on;
            access_log  off;
        }
    }
}
以上配置文件中,我们实际增加的部分是:
  location /nginx-status {
            stub_status on;
            access_log  off;
        }
同样,假如Nginx所在服务器的IP为10.0.0.1,同时指向它的域名为www.domain.com,这样一来,Nginx的状态页面便是:
http://10.0.0.1/nginx-status
或者
http://www.domain.com/nginx-status
同样,建议您将以上示例中的nginx-status修改为其它字符串。
另外,Nginx的stub_status也支持授权IP的配置,您可以参考Nginx的手册,监控宝提供的服务监控点IP地址为:
开始操作修改nginx.conf
[root@linux-node1 ~]# cd /usr/local/nginx/conf/
[root@linux-node1 conf]# vim nginx.conf
编辑如下,顺便加上访问控制

修改完毕,检测语法,启动,检查
[root@linux-node1 conf]# vim nginx.conf
[root@linux-node1 conf]# /usr/local/nginx/sbin/nginx -t
nginx: the configuration file /usr/local/nginx-1.10.3/conf/nginx.conf syntax is ok
nginx: configuration file /usr/local/nginx-1.10.3/conf/nginx.conf test is successful
[root@linux-node1 conf]# /usr/local/nginx/sbin/nginx
[root@linux-node1 conf]# lsof -i:80
COMMAND   PID USER   FD   TYPE DEVICE SIZE/OFF NODE NAME
nginx   10245 root    6u  IPv4 157419      0t0  TCP *:http (LISTEN)
nginx   10246  www    6u  IPv4 157419      0t0  TCP *:http (LISTEN)
[root@linux-node1 conf]#
网页上查看

关于状态页面的解释
Active connections: 4
server accepts handled requests
4 4 23
Reading: 0 Writing: 3 Waiting: 0
Active connections:对后端发起的活动连接数。
Server accepts handled requests:Nginx总共处理了4个连接,成功创建4次握手(证明中间没有失败的),总共处理了23个请求。
Reading:Nginx 读取到客户端的Header信息数。
Writing:Nginx 返回给客户端的Header信息数。
Waiting:开启keep-alive的情况下,这个值等于 active – (reading + writing),意思就是Nginx已经处理完成,正在等候下一次请求指令的驻留连接。
监控要做的事,最基础的部分如下:
采集,存储,展示,告警
nagios和zabbix对于一些大量主机需要监控的场景时,nagios不如zabbix
nagios监控就有瓶颈了。因为server端主动访问,1000台就有瓶颈了
zabbix主动模式完全解决,顶多就是server端的读写压力
安装zabbix3.0
在安装之前请确保防火墙以及selinux关闭,并做好时间同步
1.1、yum源配置
rpm -ivh http://mirrors.aliyun.com/zabbix/zabbix/3.0/rhel/7/x86_64/zabbix-release-3.0-1.el7.noarch.rpm
1.2、安装相关软件
zabbix把数据放到了库里,它支持mysql,centos7之后mysql默认是mariadb
yum install zabbix-server zabbix-web zabbix-server-mysql zabbix-web-mysql mariadb-server mariadb zabbix-agent -y
zabbix运行的web容器是apache,它默认把apache作为依赖安装上了
安装完毕,留意下版本
[root@linux-node1 ~]# yum install zabbix-server zabbix-web zabbix-server-mysql zabbix-web-mysql mariadb-server mariadb zabbix-agent  -y
Loaded plugins: fastestmirror
Loading mirror speeds from cached hostfile
 * base: mirrors.zju.edu.cn
 * epel: mirrors.tuna.tsinghua.edu.cn
 * extras: mirrors.aliyun.com
 * updates: mirrors.aliyun.com
Package zabbix-server-mysql-3.0.8-2.el7.x86_64 already installed and latest version
Package zabbix-web-3.0.8-2.el7.noarch already installed and latest version
Package zabbix-server-mysql-3.0.8-2.el7.x86_64 already installed and latest version
Package zabbix-web-mysql-3.0.8-2.el7.noarch already installed and latest version
Package 1:mariadb-server-5.5.52-1.el7.x86_64 already installed and latest version
Package 1:mariadb-5.5.52-1.el7.x86_64 already installed and latest version
Package zabbix-agent-3.0.8-2.el7.x86_64 already installed and latest version
Nothing to do
[root@linux-node1 ~]#
1.3、修改PHP时区配置

由于注释里带#,这里's###g' 改成's@@@g' 结构替换
sed -i 's@# php_value date.timezone Europe/Riga@php_value date.timezone Asia/Shanghai@g' /etc/httpd/conf.d/zabbix.conf
替换完毕。

二、数据库配置
Centos7上MySQL已经变成了mariadb。
2.1、启动数据库
systemctl start mariadb
2.2、创建zabbix所用的数据库及用户
mysql
create database zabbix character set utf8 collate utf8_bin;
grant all on zabbix.* to zabbix@'localhost' identified by 'zabbix';
exit
导入数据
zcat命令用于不真正解压缩文件,就能显示压缩包中文件的内容的场合。
[root@linux-node1 ~]# cd /usr/share/doc/zabbix-server-mysql-3.0.8/
[root@linux-node1 zabbix-server-mysql-3.0.8]# ls
AUTHORS  ChangeLog  COPYING  create.sql.gz  NEWS  README
[root@linux-node1 zabbix-server-mysql-3.0.8]# zcat create.sql.gz | mysql -uzabbix -pzabbix zabbix
[root@linux-node1 zabbix-server-mysql-3.0.8]#
2.3、修改zabbix配置
vim /etc/zabbix/zabbix_server.conf
取消下面注释,并修改成正确值
DBHost=localhost #数据库所在主机
DBName=zabbix #数据库名
DBUser=zabbix #数据库用户
DBPassword=zabbix #数据库密码
2.4、启动zabbix及http
遇到问题,zabbix-server启动失败,httpd启动成功
[root@linux-node1 ~]# systemctl start zabbix-server
Job for zabbix-server.service failed because a fatal signal was delivered to the control process. See "systemctl status zabbix-server.service" and "journalctl -xe" for details.
[root@linux-node1 ~]# systemctl start httpd
[root@linux-node1 ~]# getenforce
Disabled
[root@linux-node1 ~]# journalctl -xe
-- Support: http://lists.freedesktop.org/mailman/listinfo/systemd-devel
--
-- Unit zabbix-server.service has begun starting up.
Mar 19 19:12:59 linux-node1.nmap.com kernel: zabbix_server[11200]: segfault at 18 ip 00007fd7
Mar 19 19:12:59 linux-node1.nmap.com systemd[1]: zabbix-server.service: control process exite
Mar 19 19:13:01 linux-node1.nmap.com systemd[1]: Failed to start Zabbix Server.
-- Subject: Unit zabbix-server.service has failed
-- Defined-By: systemd
-- Support: http://lists.freedesktop.org/mailman/listinfo/systemd-devel
--
-- Unit zabbix-server.service has failed.
--
-- The result is failed.
Mar 19 19:13:01 linux-node1.nmap.com systemd[1]: Unit zabbix-server.service entered failed st
Mar 19 19:13:01 linux-node1.nmap.com systemd[1]: zabbix-server.service failed.
[root@linux-node1 ~]#
升级 trousers之后,启动zabbix-server成功(系统版本centos7-1503)
[root@linux-node1 ~]# yum update trousers
Loaded plugins: fastestmirror
Loading mirror speeds from cached hostfile
 * base: mirrors.zju.edu.cn
 * epel: mirror.premi.st
 * extras: mirrors.aliyun.com
 * updates: mirrors.aliyun.com
Resolving Dependencies
--> Running transaction check
---> Package trousers.x86_64 0:0.3.11.2-3.el7 will be updated
---> Package trousers.x86_64 0:0.3.13-1.el7 will be an update
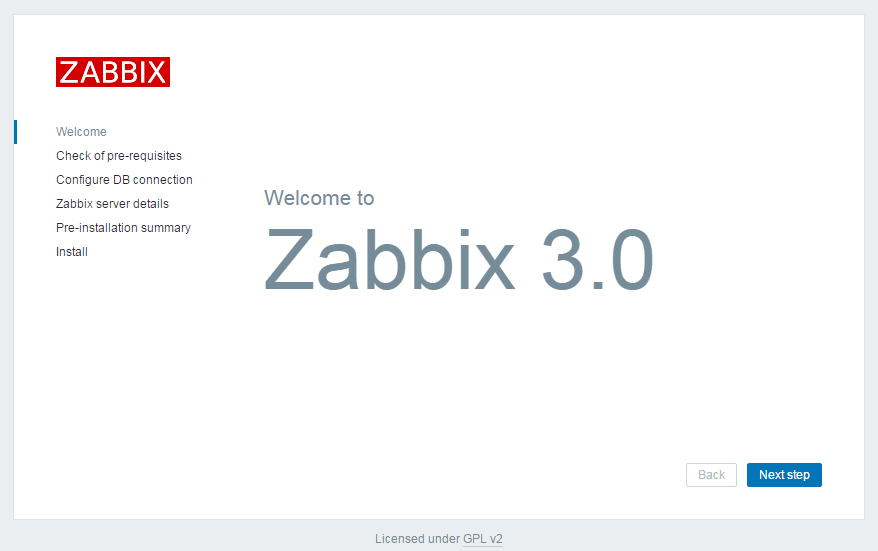
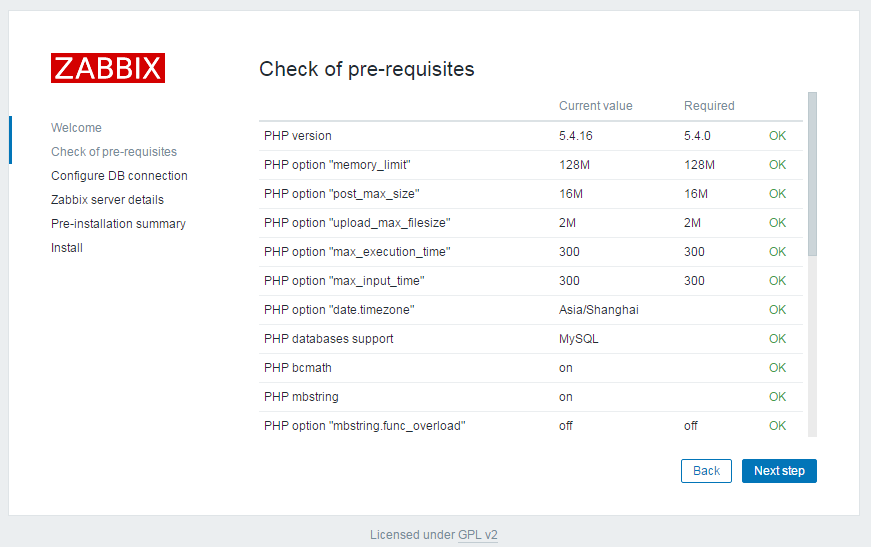
三、通过浏览器配置zabbix-server
浏览器里输入下面内容,通过页面安装配置
http://192.168.58.11/zabbix
一切OK
密码也是zabbix

name这里可以自定义,它出出现在登录后的右上角


其实以上步骤就是配置了下面文件
点击Finish出现登录界面,用户名和密码默认是Admin/zabbix

启动zabbix-agent,它默认监听10050端口
zabbix-server默认监听10051端口
[root@linux-node1 ~]# systemctl start zabbix-agent
[root@linux-node1 ~]# netstat -lntp
Active Internet connections (only servers)
Proto Recv-Q Send-Q Local Address           Foreign Address         State       PID/Program name
tcp        0      0 0.0.0.0:111             0.0.0.0:*               LISTEN      1/systemd
tcp        0      0 192.168.122.1:53        0.0.0.0:*               LISTEN      1104/dnsmasq
tcp        0      0 0.0.0.0:22              0.0.0.0:*               LISTEN      922/sshd
tcp        0      0 127.0.0.1:25            0.0.0.0:*               LISTEN      1044/master
tcp        0      0 0.0.0.0:10050           0.0.0.0:*               LISTEN      1793/zabbix_agentd
tcp        0      0 0.0.0.0:10051           0.0.0.0:*               LISTEN      1316/zabbix_server
tcp        0      0 0.0.0.0:3306            0.0.0.0:*               LISTEN      1584/mysqld
tcp6       0      0 :::111                  :::*                    LISTEN      1/systemd
tcp6       0      0 :::80                   :::*                    LISTEN      1708/httpd
tcp6       0      0 :::22                   :::*                    LISTEN      922/sshd
tcp6       0      0 ::1:25                  :::*                    LISTEN      1044/master
tcp6       0      0 :::10050                :::*                    LISTEN      1793/zabbix_agentd
tcp6       0      0 :::10051                :::*                    LISTEN      1316/zabbix_server
[root@linux-node1 ~]#
zabbix页面登录和介绍
登录成功的界面

启用此监控


它是php-gd绘制的


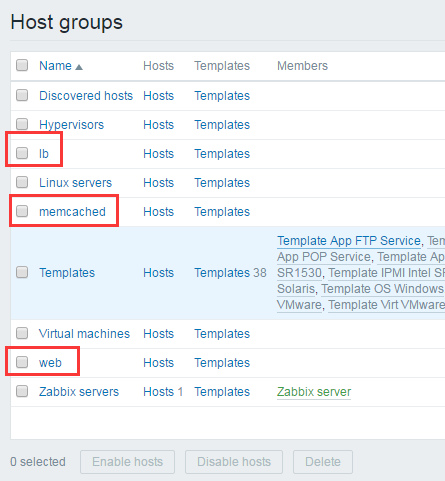
练习创建3个组:web,memcached,lb


zabbix也支持snmp,这台机器开启了snmp,这里我们就用snmp来监控

snmp这里由于是本机监控本机可以写127.0.0.1
其实推荐写成真实IP


模板这里添加snmp的模板


宏就是下面这个值
[root@linux-node1 ~]# cat /etc/snmp/snmpd.conf
rocommunity nmap 192.168.58.11
[root@linux-node1 ~]#
输入如下内容

添加完毕,看到有很多模板显示,其实括号里的都是模板的链接

如果snmp没启动,需要先启动它
[root@linux-node1 ~]# systemctl enable snmpd
Created symlink from /etc/systemd/system/multi-user.target.wants/snmpd.service to /usr/lib/systemd/system/snmpd.service.
[root@linux-node1 ~]# systemctl start snmpd
[root@linux-node1 ~]# netstat -luntp | grep 161
udp        0      0 0.0.0.0:161             0.0.0.0:*                           2549/snmpd
[root@linux-node1 ~]#
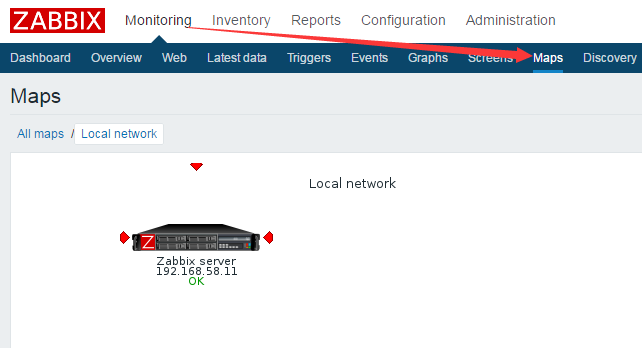
页面里查看,snmp监控也成功了

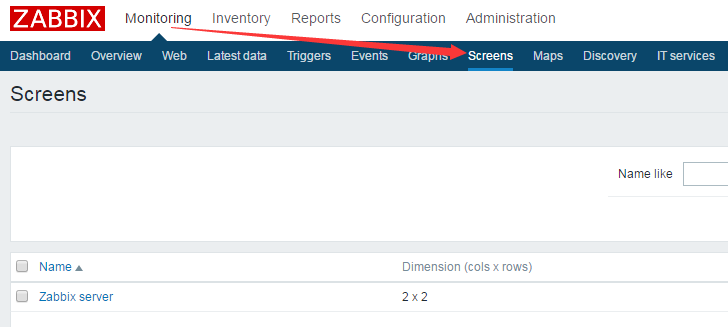
screen是几个图形放一起;2.4需要在configure下面创建;在3.0可以在monitor下创建

[root@linux-node1 ~]# cd /usr/local/nginx/conf/
[root@linux-node1 conf]# vim nginx.conf
[root@linux-node1 conf]# /usr/local/nginx/sbin/nginx -t
nginx: the configuration file /usr/local/nginx-1.10.3/conf/nginx.conf syntax is ok
nginx: configuration file /usr/local/nginx-1.10.3/conf/nginx.conf test is successful
[root@linux-node1 conf]# /usr/local/nginx/sbin/nginx
[root@linux-node1 conf]# lsof -i:8080
COMMAND  PID USER   FD   TYPE DEVICE SIZE/OFF NODE NAME
nginx   2714 root    6u  IPv4  35149      0t0  TCP *:webcache (LISTEN)
nginx   2715  www    6u  IPv4  35149      0t0  TCP *:webcache (LISTEN)
[root@linux-node1 conf]#
先用命令方式获取活动连接数
[root@linux-node1 conf]# curl http://192.168.58.11:8080/nginx-status
Active connections: 1
server accepts handled requests
 4 4 4
Reading: 0 Writing: 1 Waiting: 0
[root@linux-node1 conf]# curl http://192.168.58.11:8080/nginx-status | grep Active
  % Total    % Received % Xferd  Average Speed   Time    Time     Time  Current
                                 Dload  Upload   Total   Spent    Left  Speed
100    97  100    97    0     0  54525      0 --:--:-- --:--:-- --:--:-- 97000
Active connections: 1
[root@linux-node1 conf]# curl -s http://192.168.58.11:8080/nginx-status | grep Active
Active connections: 1
[root@linux-node1 conf]# curl -s http://192.168.58.11:8080/nginx-status | grep Active |awk  '{print $3}'
1
[root@linux-node1 conf]# curl -s http://192.168.58.11:8080/nginx-status | grep Active |awk  '{print $NF}'
1
[root@linux-node1 conf]#
vim /etc/zabbix/zabbix_agentd.conf
默认zabbix-agent的配置文件会加载下面目录,因此可以单独新建一个文件,用于存放自定义的key

写一个名叫nginx.conf的配置文件
[root@linux-node1 zabbix_agentd.d]# pwd
/etc/zabbix/zabbix_agentd.d
[root@linux-node1 zabbix_agentd.d]# cat nginx.conf
UserParameter=nginx.active,curl -s http://192.168.58.11:8080/nginx-status | grep Active |awk  '{print $NF}'
[root@linux-node1 zabbix_agentd.d]#
优化一下,脚本里的命令使用绝对路径
[root@linux-node1 zabbix_agentd.d]# which curl
/usr/bin/curl
[root@linux-node1 zabbix_agentd.d]# vim nginx.conf
[root@linux-node1 zabbix_agentd.d]# cat nginx.conf
UserParameter=nginx.active,/usr/bin/curl -s http://192.168.58.11:8080/nginx-status | grep Active |awk  '{print $NF}'
[root@linux-node1 zabbix_agentd.d]#
重启agent,安装zabbix-get工具,它是个测试工具,只有它能获取到了自定义的key的值,才能加入到zabbix-server里。
[root@linux-node1 ~]# systemctl restart zabbix-agent
[root@linux-node1 ~]# yum install -y zabbix-get
get一下,发现有问题
[root@linux-node1 ~]# zabbix_get -s 192.168.58.11 -p 10050 -k"nginx.active"
zabbix_get [3070]: Check access restrictions in Zabbix agent configuration
[root@linux-node1 ~]#
因为安装zabbix-agent的时候,Server那里写的是127.0.0.1,agent和server在一台
Server那里要写192.168.58.11
zabbix-get或者这里写127.0.0.1
下面改成192.168.58.11,这里是只允许哪个server的IP访问自己,server这里也支持多Ip

改完重启下agent
[root@linux-node1 ~]# vim /etc/zabbix/zabbix_agentd.conf
[root@linux-node1 ~]# systemctl restart zabbix-agent
[root@linux-node1 ~]#
再次获取,成功
[root@linux-node1 ~]# zabbix_get -s 192.168.58.11 -p 10050 -k"nginx.active"
1
[root@linux-node1 ~]#
网页上这里尽量也改掉

改成如下,否则会报连接故障

总结添加自定义监控项的步骤
1、命令行或脚本先获取成功
2、配置文件里添加用户自定义参数
3、重启zabbix-agent
4、server端使用zabbix_get测试获取
5、web界面创建item
这里还缺最后一步,web页面添加自定义监控项


application这里写个自定义的,它是一组item的集合

创建图形


找到nginx.active


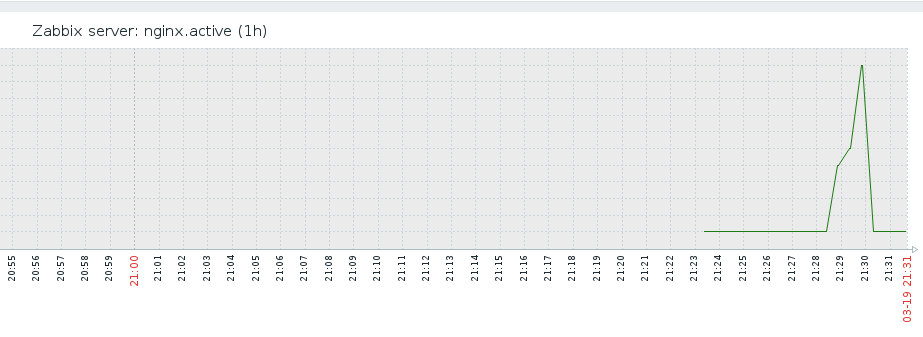
查看图形

手动制造点连接数数据
[root@linux-node1 ~]# ab -c 10 -n 100000 http://192.168.58.11:8080/
This is ApacheBench, Version 2.3 <$Revision: 1430300 $>
Copyright 1996 Adam Twiss, Zeus Technology Ltd, http://www.zeustech.net/
Licensed to The Apache Software Foundation, http://www.apache.org/

Benchmarking 192.168.58.11 (be patient)
Completed 10000 requests
Completed 20000 requests
Completed 30000 requests
Completed 40000 requests
Completed 50000 requests
Completed 60000 requests
Completed 70000 requests
Completed 80000 requests
Completed 90000 requests
Completed 100000 requests
Finished 100000 requests


Server Software:        nginx/1.10.3
Server Hostname:        192.168.58.11
Server Port:            8080

Document Path:          /
Document Length:        612 bytes

Concurrency Level:      10
Time taken for tests:   8.674 seconds
Complete requests:      100000
Failed requests:        0
Write errors:           0
Total transferred:      84500000 bytes
HTML transferred:       61200000 bytes
Requests per second:    11529.06 [#/sec] (mean)
Time per request:       0.867 [ms] (mean)
Time per request:       0.087 [ms] (mean, across all concurrent requests)
Transfer rate:          9513.73 [Kbytes/sec] received

Connection Times (ms)
              min  mean[+/-sd] median   max
Connect:        0    0   0.2      0       3
Processing:     0    1   0.2      1       8
Waiting:        0    1   0.2      1       8
Total:          0    1   0.2      1       8

Percentage of the requests served within a certain time (ms)
  50%      1
  66%      1
  75%      1
  80%      1
  90%      1
  95%      1
  98%      1
  99%      2
 100%      8 (longest request)
[root@linux-node1 ~]#
查看图形数据
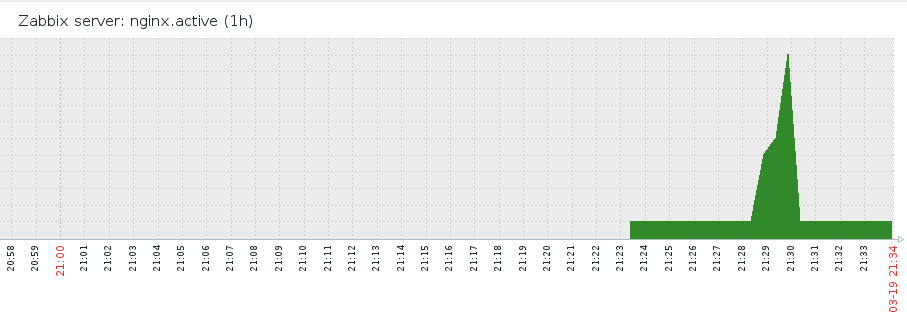
以堆叠方式显示
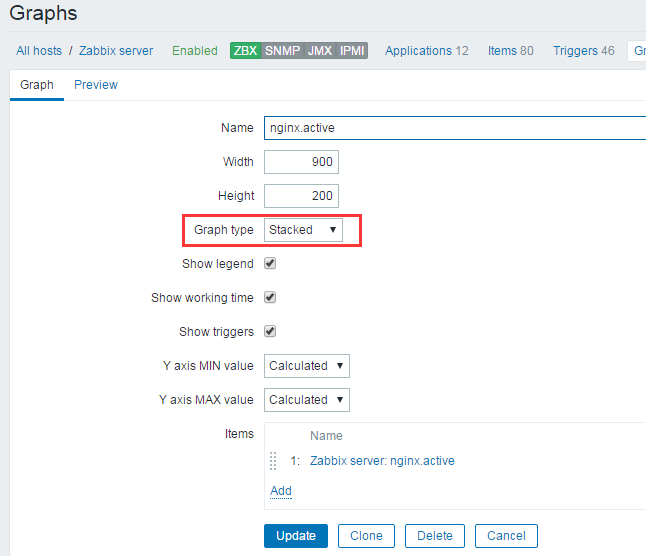
堆叠方式就是这种
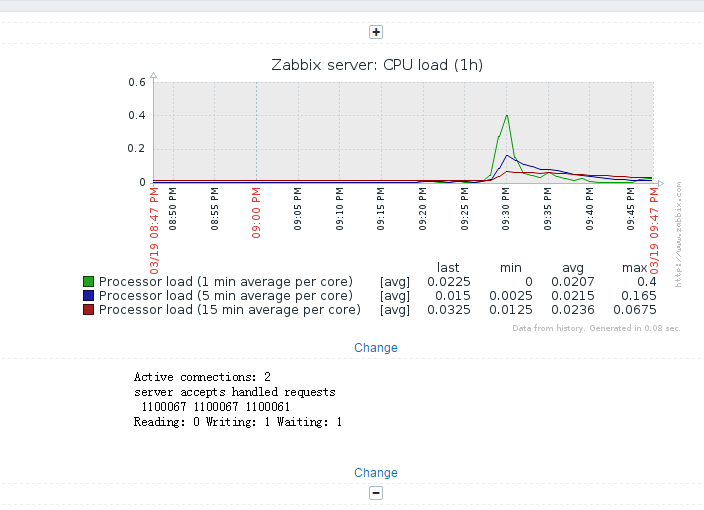
创建自定义的screen

把nginx.active这个图形加上去

把相关联的加到一个screen里面

其实可以显示很多,比如文本

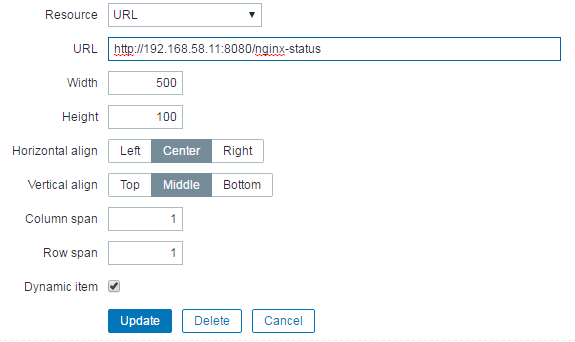
zabbix 还可以自定义map