可视化分析四
一.今日内容
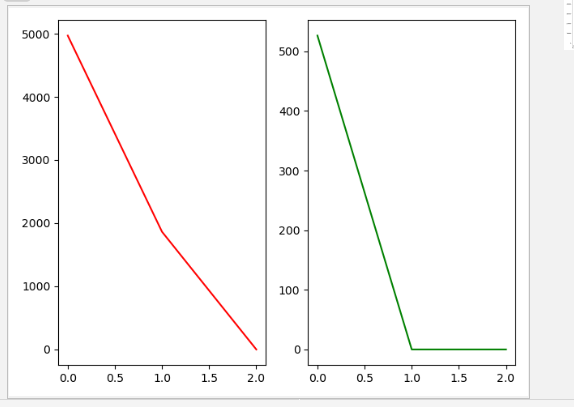
编程,在一个子图系统中,用两个水平排列的折线型子图画出M市和N市2016年1至3月的上映电影的票房总收入趋势,要求将输出的完整子图保存成图像文件ans0304.jpg;程序源代码保存成ans0304.py,要求:
左子图为M市票房总收入趋势,右子图为N市票房总收入趋势,Y轴表示票房收入,单位为“万元”,X轴表示时间,以“0、1、2、3”作为刻度值;
两子图均有说明子图内容的标题(如:M 2016 1-3 BOR);
将以下6个数据分2行按顺序存入ans0304.dat文件中,要求ans0305.dat只包含浮点型数据,以万元为单位,保留6位小数,需要保存的票房数据是:第1行3个数据,按顺序分别是M市电影市场2016年1、2、3月票房总收入,第2行三个数据,按顺序分别是N市电影市场2016年1、2、3月票房总收入,同行数据以英文逗号分隔,文件样例如下:
2023.123456,2000.654321,1988.123456
2303.123456,2100.654321,17898.123456
二.内容源码
#Author:LJK
#-*- coding:utf-8 -*-
import pandas as pd
import numpy as np
import datetime
import matplotlib.pyplot as plt
csv_file = pd.read_csv('film_log3.csv',sep=';',header=None)
csv_file.fillna(0,inplace=True)
csv_file = csv_file.drop_duplicates()
def get_city(city_name):
city = csv_file[csv_file[8].isin([city_name])]
city = city[city[2] > '2016.1.1']
return city.set_index(np.arange(len(city)))
def get_days(data):
month1 = []
month2 = []
month3 = []
for i in range(len(data)):
total = float(data[7][i].replace('票房(万)', ''))
start_time = datetime.datetime.strptime(data[1][i],"%Y.%m.%d")
end_time = datetime.datetime.strptime(data[2][i],"%Y.%m.%d")
days = (end_time - start_time).days + 1
a_day = total / days
if data[2][i] >= '2016.1.1' and data[2][i] < '2016.2.1':
month_1 = (end_time - datetime.datetime.strptime('2016.1.1','%Y.%m.%d')).days + 1
m_total1 = month_1 * a_day
month1.append(m_total1)
elif data[2][i] >= '2016.2.1' and data[2][i] < '2016.3.1':
month_2 = (end_time - datetime.datetime.strptime('2016.2.1', '%Y.%m.%d')).days + 1
m_total_21 = 31 * a_day
m_total2 = month_2 * a_day
month1.append(m_total_21)
month2.append(m_total2)
elif data[2][i] >= '2016.3.1' and data[2][i] < '2016.4.1':
month_3 = (end_time - datetime.datetime.strptime('2016.3.1', '%Y.%m.%d')).days + 1
m_total31 = 31 * a_day
m_total32 = 29 * a_day
m_total3 = month_3 * a_day
month1.append(m_total31)
month2.append(m_total32)
month3.append(m_total3)
return month1,month2,month3
def main(city_name):
city = get_city(city_name)
city_m = get_days(city)
city_m1 = sum(city_m[0])
city_m2 = sum(city_m[1])
city_m3 = sum(city_m[2])
return [city_m1,city_m2,city_m3]
m_city = main('武汉')
n_city = main('长沙')
plt.subplot(121)
plt.plot([0,1,2],m_city,'r')
plt.subplot(122)
plt.plot([0,1,2],n_city,'g')
plt.show()
三.遇到问题
主要的问题还是可视化中 matplotlib各个图像的画法以及图像数据的显示
四.解决方案
根据之前写的小程序的简单图像以及例题答案等进行参考来画出图像