sklearn-生成随机数据
import numpy as np
import pandas as pd
import matplotlib.pyplot as plt
from matplotlib.font_manager import FontProperties
from sklearn import datasets
%matplotlib inline
font = FontProperties(fname='/Library/Fonts/Heiti.ttc')
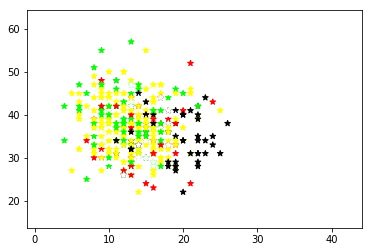
多标签分类数据
X1, y1 = datasets.make_multilabel_classification(
    n_samples=1000, n_classes=4, n_features=2, random_state=1)
datasets.make_multilabel_classification()
plt.scatter(X1[:, 0], X1[:, 1], marker='*', c=y1)
plt.show()
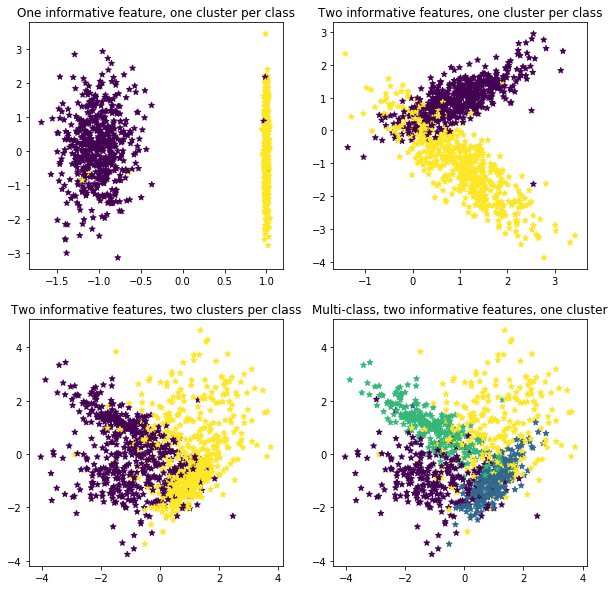
生成分类数据
import matplotlib.pyplot as plt
%matplotlib inline

plt.figure(figsize=(10, 10))

plt.subplot(221)
plt.title("One informative feature, one cluster per class", fontsize=12)
X1, y1 = datasets.make_classification(n_samples=1000, random_state=1, n_features=2, n_redundant=0, n_informative=1,
                                      n_clusters_per_class=1)
plt.scatter(X1[:, 0], X1[:, 1], marker='*', c=y1)

plt.subplot(222)
plt.title("Two informative features, one cluster per class", fontsize=12)
X1, y1 = datasets.make_classification(n_samples=1000, random_state=1, n_features=2, n_redundant=0, n_informative=2,
                                      n_clusters_per_class=1)
plt.scatter(X1[:, 0], X1[:, 1], marker='*', c=y1)

plt.subplot(223)
plt.title("Two informative features, two clusters per class", fontsize=12)
X1, y1 = datasets.make_classification(
    n_samples=1000, random_state=1, n_features=2, n_redundant=0, n_informative=2)
plt.scatter(X1[:, 0], X1[:, 1], marker='*', c=y1)


plt.subplot(224)
plt.title("Multi-class, two informative features, one cluster",
          fontsize=12)
X1, y1 = datasets.make_classification(n_samples=1000, random_state=1, n_features=2, n_redundant=0, n_informative=2,
                                      n_clusters_per_class=1, n_classes=4)
plt.scatter(X1[:, 0], X1[:, 1], marker='*', c=y1)
plt.show()
图像数据集
# 图像数据集
china = datasets.load_sample_image('china.jpg')
plt.axis('off')
plt.title('中国颐和园图像', fontproperties=font, fontsize=20)
plt.imshow(china)
plt.show()