• echarts 圆环百分比数据溢出 圆环出现不规则多边形


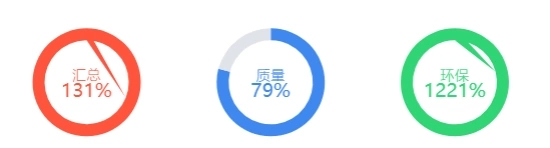
    这是数据溢出导致echarts 圆环百分比出现不规则图形。
    原因举例来源于:data: [{...}]; value: 100 - value_huizong,
    若当value_huizong大于100,则出现溢出数据导致出现负值,故问题产生。

    解决办法:
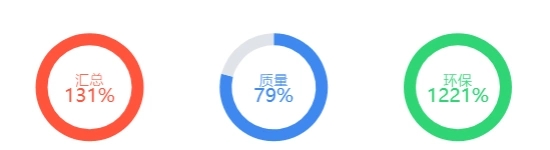
    判断思路:当每个模块数据大于100的时候,赋值100(但label中还是显示溢出数据,比如131%),若小于100则显示正常值

    最后效果与代码附上:

    var myChart = echarts.init(document.getElementById('huizong'));

    var data1 = {
            value: 131, //汇总
            text: '汇总',
            color: '#FF543C',
        };
        var data2 = {
            value: 79, //质量
            text: '质量',
            color: '#3E88F0',
        };
        var data3 = {
            value: 1221, //环保
            text: '环保',
            color: '#2FD574',
        };
    
        let value1 = data1.value || 0;
        let value2 = data2.value || 0;
        let value3 = data3.value || 0;
    
        if(value1 > 100){
            value_huizong = 100; 
        }else{
            value_huizong = value1;
        };
        if(value2 > 100){
            value_zhiliang = 100; 
        }else{
            value_zhiliang = value2;
        };
        if(value3 > 100){
            value_huanbao = 100; 
        }else{
            value_huanbao = value3;
        };
        
        option = {
            backgroundColor: '#fff',
            // tooltip: {
            //     trigger: 'item',
            // },
            series: [{
                name: '汇总',
                type: 'pie',
                radius: ['35', '45'],
                center: ['15%', '35%'],
                hoverAnimation: false,
                label: {
                    normal: {
                        position: 'center'
                    }
                },
                data: [{
                    value: value1,
                    name: data1.text,
                    itemStyle: {
                        normal: {
                            color: data1.color,
                        }
                    },
                    label: {
                        normal: {
                            textStyle: {
                                fontSize: 12,
                                fontWeight: 100,
                                color: data1.color,
                            }
                        }
                    }
                },
                {
                    value: 100 - value_huizong,
                    name: '占比',
                    tooltip: {
                        show: false
                    },
                    itemStyle: {
                        normal: {
                            color: '#E0E3E9',
                        }
                    },
                    label: {
                        normal: {
                            formatter: value1 + '' + '%',
                            textStyle: {
                                fontSize: 16,
                                color: data1.color
                            }
                        },
    
                    }
                }
                ]
            },
            {
                name: '质量',
                type: 'pie',
                radius: ['35', '45'],
                center: ['48%', '35%'],
                hoverAnimation: false,
                label: {
                    normal: {
                        position: 'center'
                    }
                },
                data: [{
                    value: value2,
                    name: data2.text,
                    itemStyle: {
                        normal: {
                            color: data2.color,
                        }
                    },
                    label: {
                        normal: {
                            textStyle: {
                                fontSize: 12,
                                fontWeight: 100,
                                color: data2.color,
                            }
                        }
                    }
                },
                {
                    value: 100 - value_zhiliang,
                    name: '占比',
                    tooltip: {
                        show: false
                    },
                    itemStyle: {
                        normal: {
                            color: '#E0E3E9',
                        }
                    },
                    label: {
                        normal: {
                            formatter: value2 + '' + '%',
                            textStyle: {
                                fontSize: 16,
                                color: data2.color
                            }
                        },
    
                    }
                }
                ]
            },
            {
                name: '环保',
                type: 'pie',
                radius: ['35', '45'],
                center: ['81%', '35%'],
                hoverAnimation: false,
                label: {
                    normal: {
                        position: 'center'
                    }
                },
                data: [{
                    value: value3,
                    name: data3.text,
                    itemStyle: {
                        normal: {
                            color: data3.color,
                        }
                    },
                    label: {
                        normal: {
                            textStyle: {
                                fontSize: 12,
                                fontWeight: 100,
                                color: data3.color,
                            }
                        }
                    }
                },
                {
                    value: 100 - value_huanbao,
                    name: '占比',
                    tooltip: {
                        show: false
                    },
                    itemStyle: {
                        normal: {
                            color: '#E0E3E9',
                        }
                    },
                    label: {
                        normal: {
                            formatter: value3 + '' + '%',
                            textStyle: {
                                fontSize: 16,
                                color: data3.color
                            }
                        },
    
                    }
                }
                ]
            }]
        }
        // 使用刚指定的配置项和数据显示图表。
        myChart.setOption(option);
  • 相关阅读:
    GL线程
    Texture,TextureRegion,Sprite,SpriteBatch
    设置壁纸
    CentOS7下安装MySQL,修改端口
    读《大道至简》有感
    课程作业01汇总整理
    读《大道至简》有感(伪代码)
    01实验性问题总结归纳
    oracle日期时间的加减法
    C# 根据年、月、周、星期获得日期等
  • 原文地址:https://www.cnblogs.com/mzq156416/p/14343110.html
Copyright © 2020-2023  润新知