话不多说直接上代码:
<!DOCTYPE html>
<html style="height: 100%">
   <head>
       <meta charset="utf-8">
   </head>
   <body style="height: 100%; margin: 0">
       <div id="Circlechart" style="height: 100%"></div>
       <script type="text/javascript" src="https://cdn.jsdelivr.net/npm/echarts/dist/echarts.min.js"></script>
       <script type="text/javascript" src="https://cdn.jsdelivr.net/npm/echarts-gl/dist/echarts-gl.min.js"></script>
       <script type="text/javascript" src="https://cdn.jsdelivr.net/npm/echarts-stat/dist/ecStat.min.js"></script>
       <script type="text/javascript" src="https://cdn.jsdelivr.net/npm/echarts/dist/extension/dataTool.min.js"></script>
       <script type="text/javascript" src="https://cdn.jsdelivr.net/npm/echarts/map/js/china.js"></script>
       <script type="text/javascript" src="https://cdn.jsdelivr.net/npm/echarts/map/js/world.js"></script>
       <script type="text/javascript" src="https://cdn.jsdelivr.net/npm/echarts/dist/extension/bmap.min.js"></script>
       <script type="text/javascript">
   function Circlelinechart(){
		            let myChart = echarts.init(document.getElementById("Circlechart"));
		            let option = {
		                color: ['#23649e', '#2e7bad', '#1dc499', '#4da7c1', '#65b5c2'],
		                grid: {
		                    left: 0,
		                    bottom: 0,
		                    top:0,
		                    containLabel: true
		                },
		                legend: {
		                    orient: 'vertical',
		                    top: "middle",
		                    right: "12%",
		                    textStyle: {
		                        color: '#788288',
		                        fontSize: 13,
		                    },
		                    icon: 'roundRect',
		                    data: [{"name": "1","value": 10},
		                            {"name": "2","value": 10},
		                            { "name": "3","value": 10},
		                            {"name": "4","value": 10},
		                            {"name": "5","value": 10},  ],
		                },
		                series: [
		                    // 主要展示层的
		                    {
		                        radius: ['30%', '61%'],
		                        center: ['50%', '50%'],
		                        type: 'pie',
		                        label: {
		                            normal: {
		                            show: true,
		                            formatter: "{c}%",
		                            textStyle: {
		                                fontSize: 13,
		                            },
		                            position: 'outside'
		                            },
		                            emphasis: {
		                                show: true
		                            }
		                        },
		                        labelLine: {
		                            normal: {
		                                show: true,
		                                length: 20,
		                                length2: 35
		                            },
		                            emphasis: {
		                                show: true
		                            }
		                        },
		                        name: "民警训练总量",
		                        data: [{"name": "1","value": 10},
		                            {"name": "2","value": 10},
		                            { "name": "3","value": 10},
		                            {"name": "4","value": 10},
		                            {"name": "5","value": 10},  ],
		                    },
		                    // 边框的设置
		                    {
														name: '内边框',
		                        radius: ['30%', '34%'],
		                        center: ['50%', '50%'],
		                        type: 'pie',
		                        label: {
		                            normal: {
		                                show: false
		                            },
		                            emphasis: {
		                                show: false
		                            }
		                        },
		                        labelLine: {
		                            normal: {
		                                show: false
		                            },
		                            emphasis: {
		                                show: false
		                            }
		                        },
		                        animation: false,
		                        tooltip: {
		                            show: false
		                        },
		                        data: [{
		                            value: 1,
		                            itemStyle: {
		                                color: "rgba(170, 0, 0, 76)",
		                            },
		                        }],
		                    }, {
		                        name: '外边框',
		                        type: 'pie',
		                        clockWise: false, //顺时加载
		                        hoverAnimation: false, //鼠标移入变大
		                        center: ['50%', '50%'],
		                        radius: ['65%', '65%'],
		                        label: {
		                            normal: {
		                                show: false
		                            }
		                        },
		                        data: [{
		                            value: 9,
		                            name: '',
		                            itemStyle: {
		                                normal: {
		                                    borderWidth: 2,
		                                    borderColor: '#61bad3'
		                                }
		                            }
		                        }]
		                    },
		                ]
		            };
		            myChart.setOption(option);
		        }
		Circlelinechart()
       </script>
   </body>
</html>
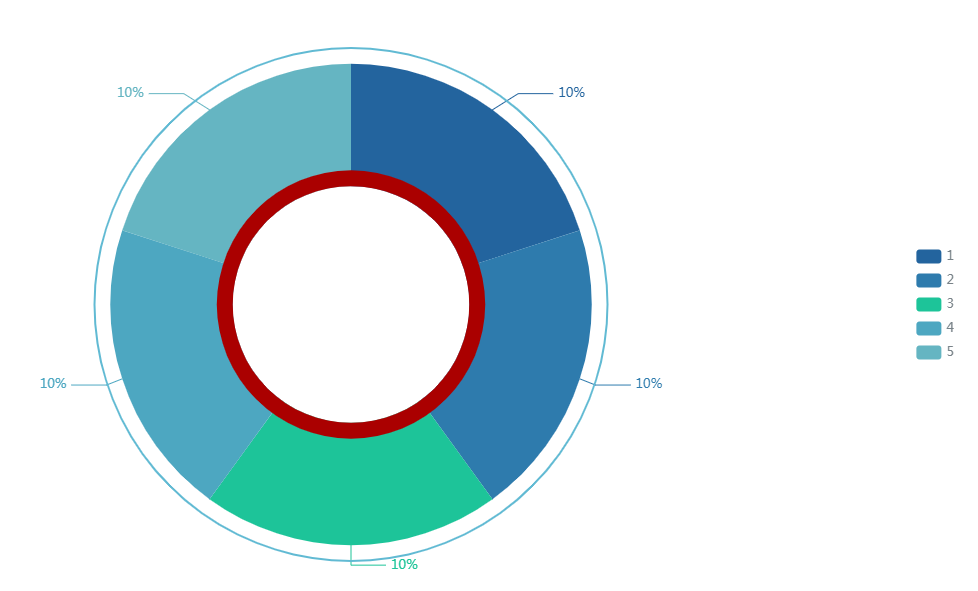
效果图:

<!DOCTYPE html>
<html style="height: 100%">
   <head>
       <meta charset="utf-8">
   </head>
   <body style="height: 100%; margin: 0">
       <div id="echart" style="height: 100%"></div>
       <script type="text/javascript" src="https://cdn.jsdelivr.net/npm/echarts/dist/echarts.min.js"></script>
       <script type="text/javascript" src="https://cdn.jsdelivr.net/npm/echarts-gl/dist/echarts-gl.min.js"></script>
       <script type="text/javascript" src="https://cdn.jsdelivr.net/npm/echarts-stat/dist/ecStat.min.js"></script>
       <script type="text/javascript" src="https://cdn.jsdelivr.net/npm/echarts/dist/extension/dataTool.min.js"></script>
       <script type="text/javascript" src="https://cdn.jsdelivr.net/npm/echarts/map/js/china.js"></script>
       <script type="text/javascript" src="https://cdn.jsdelivr.net/npm/echarts/map/js/world.js"></script>
       <script type="text/javascript" src="https://cdn.jsdelivr.net/npm/echarts/dist/extension/bmap.min.js"></script>
       <script type="text/javascript">
function setEchartsPie(id, data) {
    let $el = document.getElementById(id);
    let myChart = this.echarts.init($el, '', {
         450,
        height: 300,
    });
    let dataName = [];
    data.forEach((res) => {
        dataName.push(res.name);
    });
    let option = {
        title: {
            zlevel: 0,
            text: [
                '{value|¥' + 10000 + '}',
                '{name|总金额}',
            ].join('
'),
            rich: {
                value: {
                    color: '#303133',
                    fontSize: 40,
                    fontWeight: 'bold',
                    lineHeight: 40,
                },
                name: {
                    color: '#909399',
                    lineHeight: 20
                },
            },
            top: 'center',
            left: '145',
            textAlign: 'center',
            textStyle: {
                rich: {
                    value: {
                        color: '#303133',
                        fontSize: 40,
                        fontWeight: 'bold',
                        lineHeight: 40,
                    },
                    name: {
                        color: '#909399',
                        lineHeight: 20
                    },
                },
            },
        },
        tooltip: { // 悬停指示
            trigger: 'item',
            formatter: "{b}: {c} ({d}%)"
        },
        legend: {
            orient: 'vertical',
            x: 'right',
            data: dataName,
            itemGap: 30,
            top: 'middle',
            align: 'left',
            icon: 'circle',
            formatter: function (name) {
                return name;
            }
        },
        series: [
            {
                name: '访问来源',
                type: 'pie',
                radius: ['80%', '84%'],
                center: [150, '50%'],
                stillShowZeroSum: false,
                avoidLabelOverlap: false,
                zlevel: 1,
                label: {
									show:false
                },
                data: data
            }
        ],
        color: ['#410ADF','#F42850','#F6A93B','#7ED321','#282828']
    };
    myChart.setOption(option);
}

setEchartsPie('echart', [
    { value: 300, name: '课程报名' },
    { value: 350, name: '服装收费' },
    { value: 250, name: '物料收费' },
    { value: 100, name: '其它收费' },
]);
       </script>
   </body>
</html>
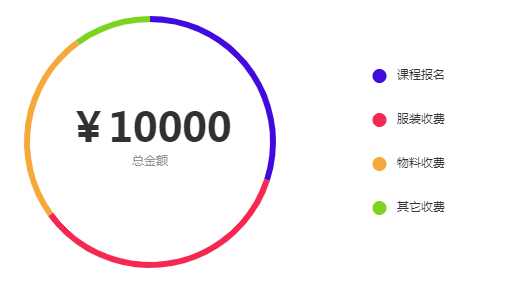
效果图:

<!DOCTYPE html>
<html style="height: 100%">
   <head>
       <meta charset="utf-8">
   </head>
   <body style="height: 100%; margin: 0">
       <div id="echart" style="height: 100%"></div>
       <script type="text/javascript" src="https://cdn.jsdelivr.net/npm/echarts/dist/echarts.min.js"></script>
       <script type="text/javascript" src="https://cdn.jsdelivr.net/npm/echarts-gl/dist/echarts-gl.min.js"></script>
       <script type="text/javascript" src="https://cdn.jsdelivr.net/npm/echarts-stat/dist/ecStat.min.js"></script>
       <script type="text/javascript" src="https://cdn.jsdelivr.net/npm/echarts/dist/extension/dataTool.min.js"></script>
       <script type="text/javascript" src="https://cdn.jsdelivr.net/npm/echarts/map/js/china.js"></script>
       <script type="text/javascript" src="https://cdn.jsdelivr.net/npm/echarts/map/js/world.js"></script>
       <script type="text/javascript" src="https://cdn.jsdelivr.net/npm/echarts/dist/extension/bmap.min.js"></script>
       <script type="text/javascript">
function setEchartsPie(id, data) {
    let $el = document.getElementById(id);
    let myChart = this.echarts.init($el, '', {
         450,
        height: 300,
    });
    let dataName = [];
    let total = 0;
    data.forEach((res) => {
        dataName.push(res.name);
        total += parseFloat(res.value) * 10000;
    });
    total = total / 10000;
    let option = {
        title: {
            zlevel: 0,
            text: [
                '{value|¥' + total + '}',
                '{name|总金额}',
            ].join('
'),
            rich: {
                value: {
                    color: '#303133',
                    fontSize: 40,
                    fontWeight: 'bold',
                    lineHeight: 40,
                },
                name: {
                    color: '#909399',
                    lineHeight: 20
                },
            },
            top: 'center',
            left: '145',
            textAlign: 'center',
            textStyle: {
                rich: {
                    value: {
                        color: '#303133',
                        fontSize: 40,
                        fontWeight: 'bold',
                        lineHeight: 40,
                    },
                    name: {
                        color: '#909399',
                        lineHeight: 20
                    },
                },
            },
        },
        tooltip: { // 悬停指示
            trigger: 'item',
            formatter: "{b}: {c} ({d}%)"
        },
        legend: {
            orient: 'vertical',
            x: 'right',
            data: dataName,
            itemGap: 30,
            top: 'middle',
            align: 'left',
            icon: 'circle',
            formatter: function (name) {
                return name;
            }
        },
        series: [
            {
                name: '访问来源',
                type: 'pie',
                radius: ['80%', '84%'],
                center: [150, '50%'],
                stillShowZeroSum: false,
                avoidLabelOverlap: false,
                zlevel: 1,
                label: {
                    normal: {
                        padding: [30, 30, 30, 30],
                        backgroundColor: '#fff',
                        show: false,
                        position: 'center',
                        formatter: [
                            '{value|¥{c}}',
                            '{name|{b}}'
                        ].join('
'),
                        rich: {
                            value: {
                                color: '#303133',
                                fontSize: 40,
                                fontWeight: 'bold',
                                lineHeight: 40,
                            },
                            name: {
                                color: '#909399',
                                lineHeight: 20
                            },
                        },
                    },
                    emphasis: {
                        show: true,
                        textStyle: {
                            fontSize: '16',
                            fontWeight: 'bold'
                        }
                    }
                },
                data: data
            }
        ],
        color: ['#410ADF','#F42850','#F6A93B','#7ED321','#282828']
    };
    myChart.setOption(option);
}

setEchartsPie('echart', [
    { value: 300, name: '课程报名' },
    { value: 350, name: '服装收费' },
    { value: 250, name: '物料收费' },
    { value: 100, name: '其它收费' },
]);
       </script>
   </body>
</html>
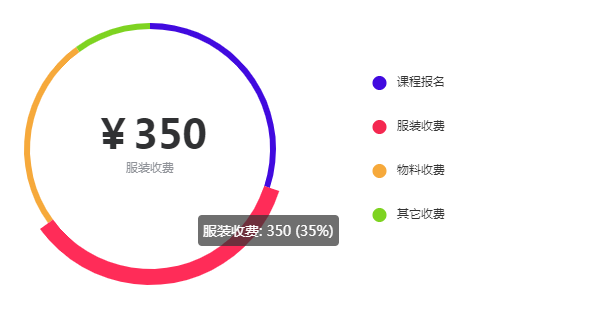
效果图:
