有时候后端有些数据需要进行展现,如果写html的td/tr什么的,比较费时费劲,而且通用性不强,下面就介绍一下jqgrid的使用,能够快速搭建一个表格,进行数据的展现和排序等基本操作。
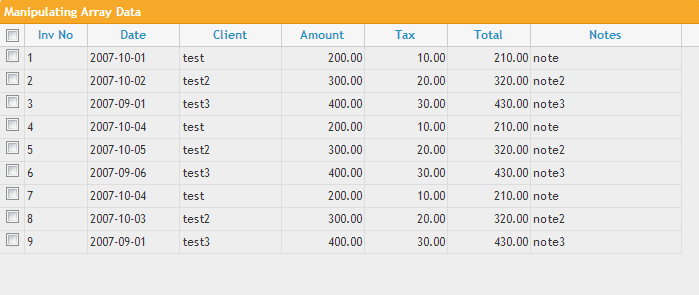
jqgrid是jquery的表格插件,jqgrid可以从后台获取数据,数据格式支持json,xml,array等,jqGrid是典型的B/S架构,服务器端只是提供数据管理,客户端只提供数据显示。jqGrid是用ajax来实现对请求与响应的处理。jqgrid的效果如下:
1、jqgrid的安装
1.1 下载
jqgrid下载: http://www.trirand.com/blog/?page_id=6 ,全部加载,直接download即可
jquery ui下载: http://download.jqueryui.com/download ,选择最新版本即可
1.2 部署
解压到一个目录,此时包含2个文件夹:jqgrid和jquery-ui,具体版本每次可能不太一样
部署到web服务器下,在http服务器下,新建一个目录mysite,里面创建2个文件夹css和js,然后拷贝文件:
将jqgrid/css/ui.jqgrid.css拷贝到mysite/css/ui.jqgrid.css下面
将jqgrid/js/的所有文件拷贝到mysite/js/下面
将jquery-ui-1.11.2/下面的所有css文件拷贝到mysite/css下面
将jquery-ui-1.11.2/下面的所有js文件拷贝到mysite/js下面
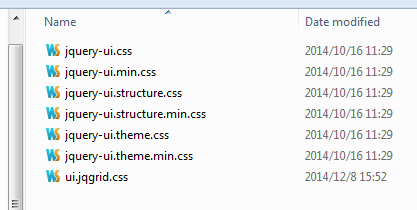
mysite的css目录结构应该是:
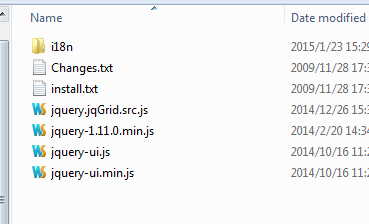
mysite的js目录结构应该是:
2、jqgrid的使用
需要引入两个css文件,3个js文件,其中一个包括语言文件
最简单的index.html例子
<!DOCTYPE html PUBLIC "-//W3C//DTD XHTML 1.0 Strict//EN" "http://www.w3.org/TR/xhtml1/DTD/xhtml1-strict.dtd">
<html xmlns="http://www.w3.org/1999/xhtml" xml:lang="en" lang="en">
<head>
    <meta http-equiv="Content-Type" content="text/html; charset=utf-8" />
    <title>My First jqGrid</title>

    <link rel="stylesheet" type="text/css" media="screen" href="css/jquery-ui.min.css" />
    <link rel="stylesheet" type="text/css" media="screen" href="css/ui.jqgrid.css" />

    <style>
        html, body {
            margin: 0;
            padding: 0;
            font-size: 75%;
        }
    </style>
    <script src="js/jquery-1.11.0.min.js" type="text/javascript"></script>
    <script src="js/i18n/grid.locale-en.js" type="text/javascript"></script>
    <script src="js/jquery.jqGrid.src.js" type="text/javascript"></script>

    <script type="text/javascript">
        $(function(){
            pageInit();
        });
        function pageInit(){
            jQuery("#list4").jqGrid(
                    {
                        datatype : "local",
                        height : 250,
                        colNames : [ 'Inv No', 'Date', 'Client', 'Amount', 'Tax','Total', 'Notes' ],
                        colModel : [
                            {name : 'id',index : 'id',width : 60,sorttype : "int"},
                            {name : 'invdate',index : 'invdate',width : 90,sorttype : "date"},
                            {name : 'name',index : 'name',width : 100},
                            {name : 'amount',index : 'amount',width : 80,align : "right",sorttype : "float"},
                            {name : 'tax',index : 'tax',width : 80,align : "right",sorttype : "float"},
                            {name : 'total',index : 'total',width : 80,align : "right",sorttype : "float"},
                            {name : 'note',index : 'note',width : 150,sortable : false}
                        ],
                        multiselect : true,
                        caption : "Manipulating Array Data"
                    });
            var mydata = [
                {id : "1",invdate : "2007-10-01",name : "test",note : "note",amount : "200.00",tax : "10.00",total : "210.00"},
                {id : "2",invdate : "2007-10-02",name : "test2",note : "note2",amount : "300.00",tax : "20.00",total : "320.00"},
                {id : "3",invdate : "2007-09-01",name : "test3",note : "note3",amount : "400.00",tax : "30.00",total : "430.00"},
                {id : "4",invdate : "2007-10-04",name : "test",note : "note",amount : "200.00",tax : "10.00",total : "210.00"},
                {id : "5",invdate : "2007-10-05",name : "test2",note : "note2",amount : "300.00",tax : "20.00",total : "320.00"},
                {id : "6",invdate : "2007-09-06",name : "test3",note : "note3",amount : "400.00",tax : "30.00",total : "430.00"},
                {id : "7",invdate : "2007-10-04",name : "test",note : "note",amount : "200.00",tax : "10.00",total : "210.00"},
                {id : "8",invdate : "2007-10-03",name : "test2",note : "note2",amount : "300.00",tax : "20.00",total : "320.00"},
                {id : "9",invdate : "2007-09-01",name : "test3",note : "note3",amount : "400.00",tax : "30.00",total : "430.00"}
            ];
            for ( var i = 0; i <= mydata.length; i++){
                jQuery("#list4").jqGrid('addRowData', i + 1, mydata[i]);
            }
        }
    </script>

</head>
<body>
<table id="list4"></table>
<div id="pager2"></div>
</body>
</html>


