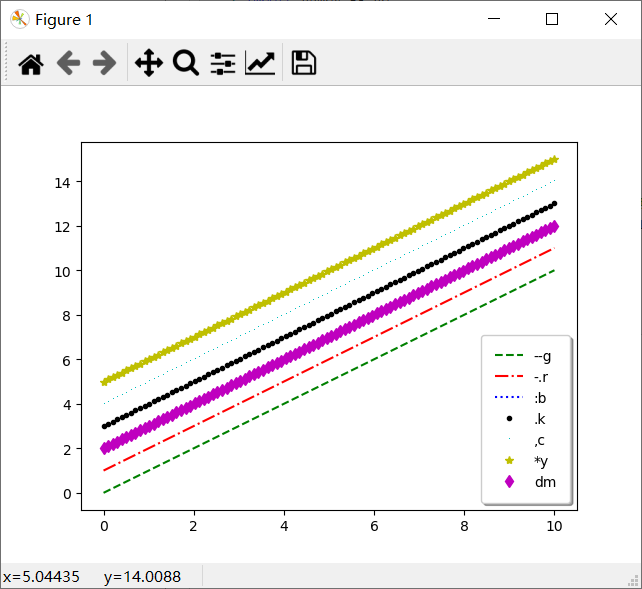
 1 import matplotlib.pyplot as plt
 2 import numpy as np
 3 x = np.linspace(0,10,100)
 4 #添加legend()图例,给plot方法添加参数label
 5 plt.plot(x,x+0,'--g',label='--g')
 6 plt.plot(x,x+1,'-.r',label='-.r')
 7 plt.plot(x,x+2,':b',label=':b')
 8 plt.plot(x,x+3,'.k',label='.k')
 9 plt.plot(x,x+4,',c',label=',c')
10 plt.plot(x,x+5,'*y',label='*y')
11 plt.plot(x,x+2,'dm',label='dm')
12 #添加图例右下角lower right  左上角upper left 边框  透明度  阴影  边框宽度
13 plt.legend(loc='lower right',fancybox=True,framealpha=1,shadow=True,borderpad=1)
14 plt.show()
