词频、分词和可视化结合爬虫,做一些作业。
- 爬虫库requests
- 词频统计库collections
- 数据处理库numpy
- 结巴分词库jieba
- 可视化库pyecharts等等。
数据的话直接从网上抠一些东西,这里抠一篇新闻。要导入的库,一次性导入:
 1 import collections
 2 import re
 3 import jieba
 4 import requests
 5 import parsel
 6 from pyecharts.charts import Bar
 7 from pyecharts.globals import ThemeType
 8 import pyecharts.options as opts
 9 from stylecloud import stylecloud
10 from wordcloud import WordCloud
11 from PIL import Image
12 from matplotlib import pyplot as plt
13 import numpy as np
第一部分,提取网页内容并写入到文档。
 1 def get_text():
 2     url = 'http://cpc.people.com.cn/n1/2022/0110/c164113-32327931.html'
 3     headers = {
 4         'User-Agent':'Mozilla/5.0 (Windows NT 10.0; Win64; x64) AppleWebKit/537.36 (KHTML, like Gecko) Chrome/97.0.4692.71 Safari/537.36',
 5     }
 6
 7     response = requests.get(url=url, headers=headers)
 8     response.raise_for_status()
 9     response.encoding = response.apparent_encoding
10     print(response.text)
11     selector = parsel.Selector(response.text)
12     textResults = selector.xpath('//div[@class="show_text"]/p/text()').getall()
13     # 这种方式没有获取到粗体
14     with open('test.txt', mode='w+', encoding='utf-8') as f:
15         for item in textResults:
16             f.write(item + '\n') #
第二部分,词频统计,用collections,以便做统计词频的条形图的时候使用。
 1 def words_counts():
 2     with open('test.txt', mode='r', encoding='utf-8') as f:
 3         strData = f.read()
 4
 5     # 替换符合parrtern的文本
 6     pattern = re.compile(r'\t|,|/|。|\n|\.|-|:|;|\)|\(|\?|,。,!”"')
 7     strData = re.sub(pattern, '', strData)  # 将符合模式的字符去除
 8
 9     # 开始分词,精准模式
10     words = jieba.cut(strData, cut_all=False)
11     resultWords = [] # 空列表
12     # 自定义停用词
13     stopWords = [u'的', u'要', u'“', u'”', u'和', u',', u'为', u'是',
14                     '以' u'随着', u'对于', u'对', u'等', u'能', u'都', u'。',
15                     u' ', u'、', u'中', u'在', u'了', u'通常', u'如果', u'我',
16                     u'她', u'(', u')', u'他', u'你', u'?', u'—', u'就',
17                     u'着', u'说', u'上', u'这', u'那', u'有', u'也',
18                     u'什么', u'·', u'将', u'没有', u'到', u'不', u'去']
19     #
20     for word in words:
21         if word not in stopWords:
22             resultWords.append(word)
23     # print(resultWords) #  打印结果
24
25     # 开始统计词频
26     word_counts = collections.Counter(resultWords) # 一个词频统计对象
27     # print(word_counts)
28
29     # 获取高频词的列表
30     word_counts_all = word_counts.most_common() # 一个列表,列表里是元组
31     # print(word_counts_all)
32     word_counts_top10 = word_counts.most_common(10)
33     return word_counts_top10
第三部分,利用stylecloud和wordcloud制作词。
首先是stylecloud:
 1 def gen_style_words():
 2     with open('test.txt', mode='r', encoding='utf-8') as f:
 3         word_list = jieba.cut(f.read())
 4         print(word_list)
 5         result_words = ' '.join(word_list)
 6         print(result_words)
 7     # 制作词云
 8     # 停用词
 9     stopWords = [u'的', u'要', u'“', u'”', u'和', u',', u'为', u'是',
10                  '以' u'随着', u'对于', u'对', u'等', u'能', u'都', u'。',
11                  u' ', u'、', u'中', u'在', u'了', u'通常', u'如果', u'我',
12                  u'她', u'(', u')', u'他', u'你', u'?', u'—', u'就',
13                  u'着', u'说', u'上', u'这', u'那', u'有', u'也',
14                  u'什么', u'·', u'将', u'没有', u'到', u'不', u'去']
15     stylecloud.gen_stylecloud(
16         text=result_words,
17         size=1280,  # stylecloud的大小,长度和宽度,
18         font_path='C:\\Windows\\Fonts\\simhei.ttf',  # 字体路径
19         max_words=150,  # stylecloud中能容的最多词数
20         max_font_size=200,  # 最大字号
21         # invert_mask=, # 蒙版
22         custom_stopwords=stopWords,  # 停用词
23         output_name='1.png',  # 输出的名字
24     )
结果展示:

其次是worldcloud:
 1 def word_cloud_style():
 2     """
 3     另外一种生成词云的方法
 4     """
 5     # f = open('../Spiders/content.txt', 'r', encoding='utf-8')  # 这是数据源,也是想生成词云的数据
 6     # txt = f.read()  # 读取文件
 7     # print(type(txt))
 8     # print('=========================================')
 9     # f.close()  # 关闭文件,其实可以用withopen
10     with open('test.txt', mode='r', encoding='utf-8') as f:
11         txt = f.read()
12     # 如果是文章的话,需要用到jieba分词,分完之后也可以自己处理下再生成词云
13     newTxt = re.sub("A-Z0-9-a-z\!\%\[\]\,\。", "", txt)
14     # print(newTxt)
15
16     words = jieba.lcut(newTxt)
17     print(words)
18     img = Image.open(r'wc.jpg')  # 想要做的形状
19     img_array = np.array(img)
20
21     # 相关配置,里面这个collections可以避免重复
22     wordcloud = WordCloud(
23         background_color='white',
24         width=1080,
25         height=960,
26         # font_path = "../文悦新青年.otf",
27         font_path='C:/Windows/Fonts/simhei.ttf',
28         max_words=150,
29         scale=10,  # 清晰度
30         max_font_size=100,
31         mask=img_array,
32         collocations=False).generate(newTxt)
33
34     plt.imshow(wordcloud)
35     plt.axis('off')
36     plt.show()
37     wordcloud.to_file('wc.png')
结果展示:

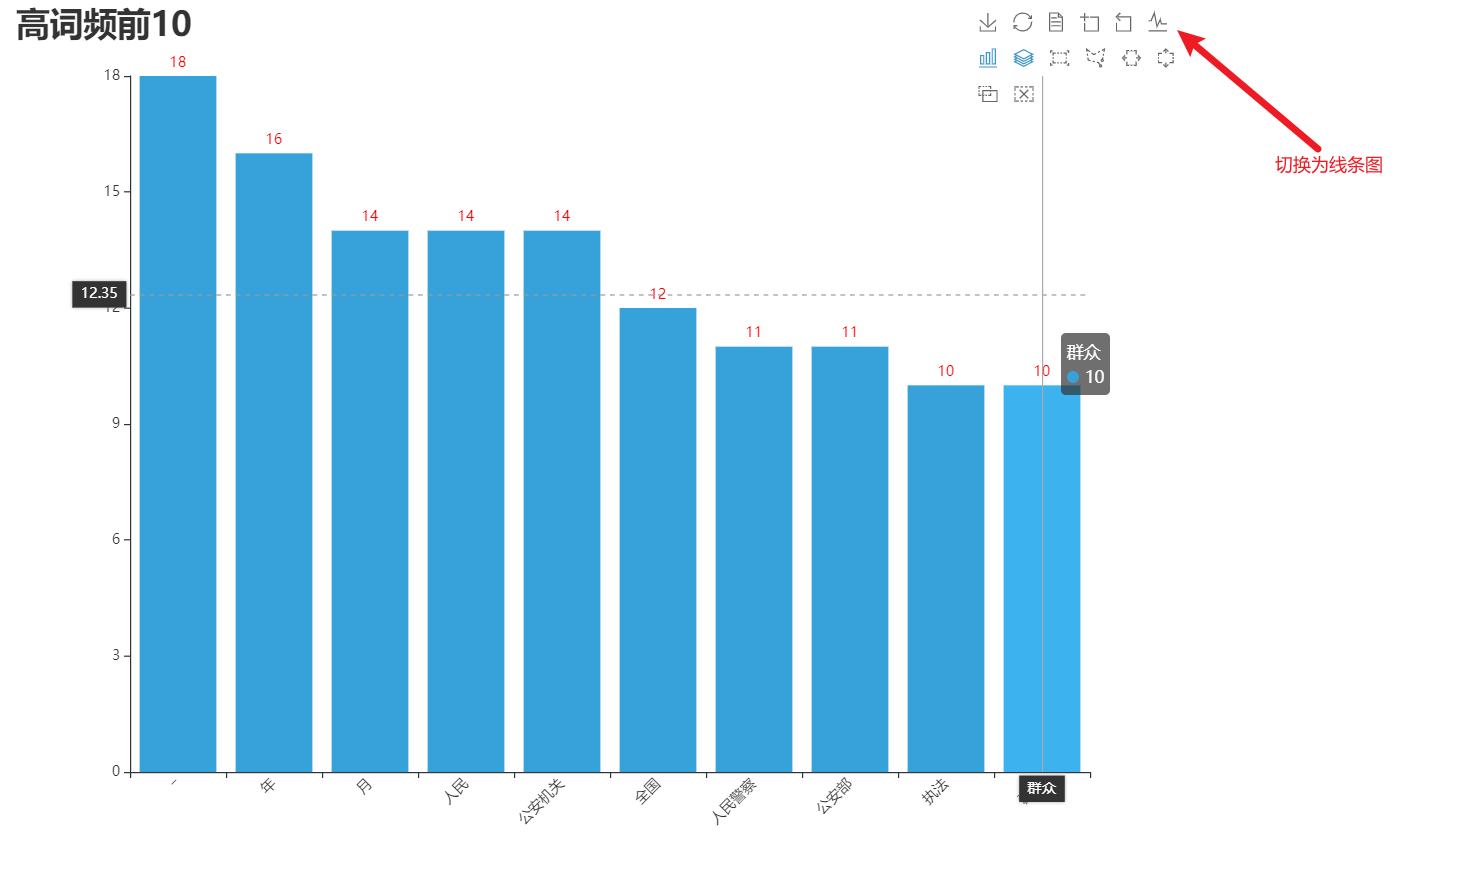
第四部分,词频统计条形图。
 1 def echart_top_10():
 2     data = words_counts()
 3     lab = [i[0] for i in data]
 4     num = [i[1] for i in data]
 5     # print(lab, num)
 6
 7     bar = (
 8         Bar(init_opts=opts.InitOpts(width='1000px', height='700px', theme=ThemeType.LIGHT))
 9         .add_xaxis(xaxis_data=lab)
10         .add_yaxis(
11             series_name='',
12             y_axis=num,
13             label_opts=opts.LabelOpts(is_show=True, color='red'),
14             bar_max_width='100px',
15         )
16         .set_global_opts(
17             title_opts=opts.TitleOpts(
18                 title='高词频前10',
19                 title_textstyle_opts=opts.TextStyleOpts(font_size=28,)
20             ),
21             legend_opts=opts.LegendOpts(
22                 pos_top='10%',
23                 pos_left='10%',
24             ),
25             xaxis_opts=opts.AxisOpts(
26                 axislabel_opts=opts.LabelOpts(rotate=45), # 倾斜45度
27             ),
28             toolbox_opts=opts.ToolboxOpts(),
29             tooltip_opts=opts.TooltipOpts(
30                 is_show=True,
31                 trigger='axis',# 触发类型,(axis表示坐标轴触发,鼠标移动上去的时候会有一条垂直于x轴的实线跟随鼠标移动,并且提示信息)
32                 axis_pointer_type='cross',# 指示器类型,(Cross表示生成两条分别垂直于x轴和y轴的虚线,不启用trigger才会显示完全)
33             ),
34         )
35     ).render('top10.html')
词频统计条形图,调用了工具栏,可以通过右上角的工具栏切换为线图。