使用iReport生成表格
一 环境:iReport-5.6.0 JDK7
1.注意,iReport的最新版本目前还不支持JDK8,如果项目工程已经配置了JDK8,那也不用去修改环境变量和工程的配置,只要修改iReport的配置文件即可。找到etc路径下的ireport.conf,将以下一行:
#jdkhome="/path/to/jdk"
改为jdk7的路径,如:
jdkhome="C:Program FilesJavajdk1.7.0_67"
这样iReport就可以顺利启动了。
2.打开iReport
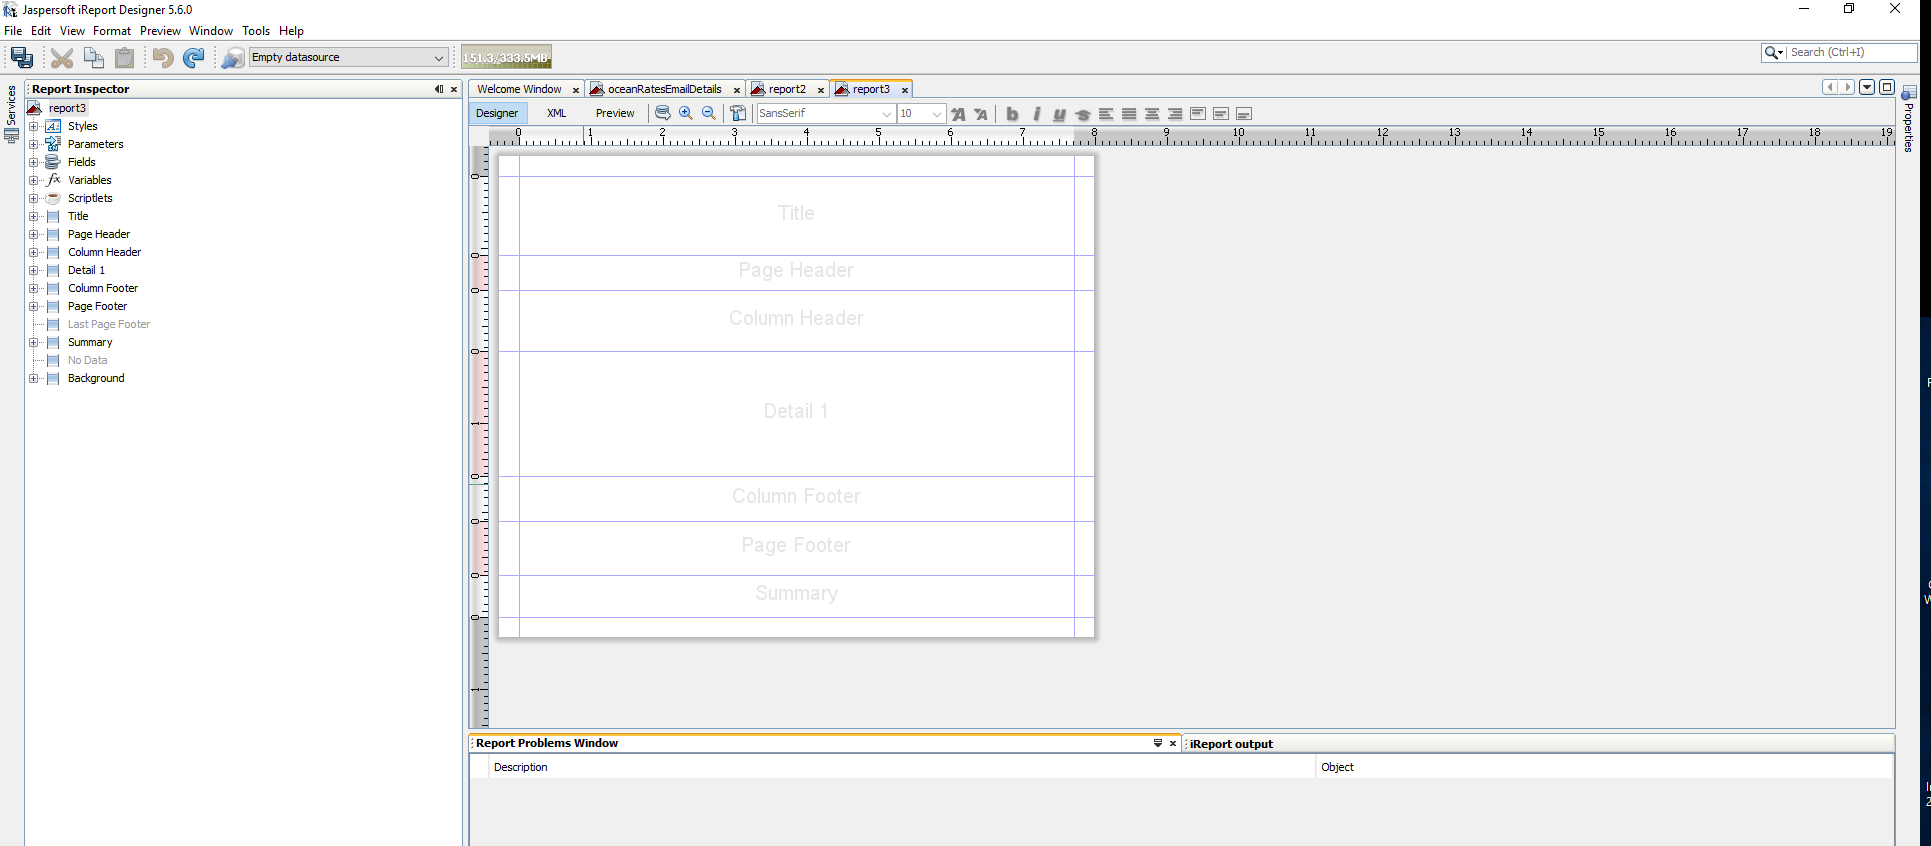
有几个比较常用的工具栏:
Window-->Palette 和 Properties,这两个可以用来处理元素和样式,是常用的两个工具栏
二 使用过程
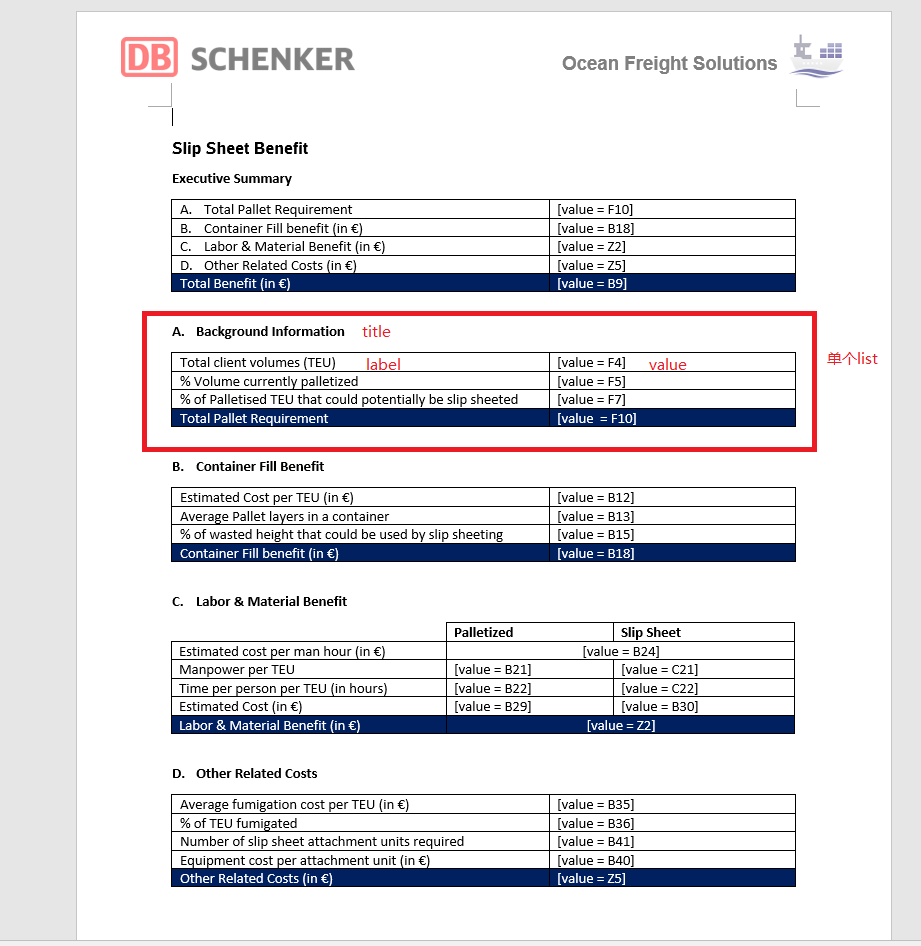
1. 先介绍一下最终希望生成的效果:
2. 看一下java端的代码:
最终iReport要用到的数据是List<OceanRatesEmailMessage>这样的lists,每个list包含一个title以及对应的label和value
public class OceanRatesEmailMessage {
private String title; //对应A. Backendground Information这样的title
private List<OceanRatesDetails> oceanRatesDetails;
......
}
public class OceanRatesDetails {
private String label; //label
private Object value; //value
private Integer combineColumns; //控制value是分成一行还是两行
private boolean needHighLight; //控制最后一行的颜色
.......
}
3.添加数据源
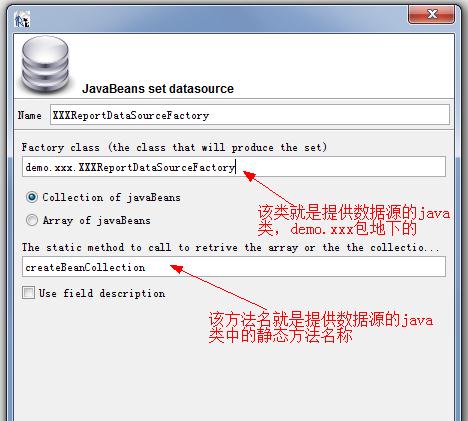
如果通过JavaBeans set data source的方式来添加数据源,那么就需要提供一个类,这个即类名即图二的Name参数,这个类的路径即图二的Factory class参数,这个类里必须要有一个静态方法,提供所有的数据,这个方法名即The static method....参数。
这里不通过这种方式添加数据源。程序中并没有提供静态方法的类。

4.指定要在页面展示和页面控制的数据
首先确定所有页面上要用到的数据,即title和 List<OceanRatesDetails>,将这两个参数添加到fields里。这里相当于是定义了数据名以及数据类型。这里List类型的数据还要定义List中包含的数据。

这部分的数据可以从java文件里引入。tools-->options-->classpath,将这个模块下的所有要用到的java文件引用进来:
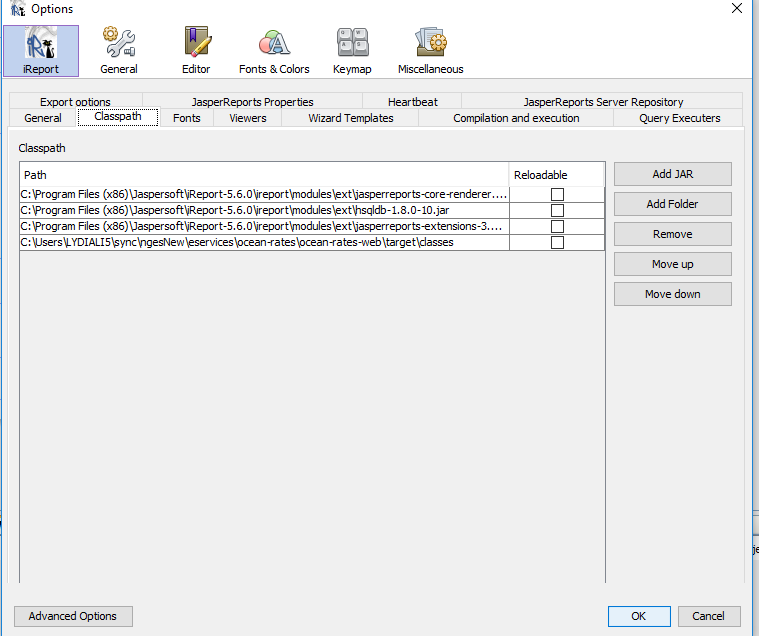
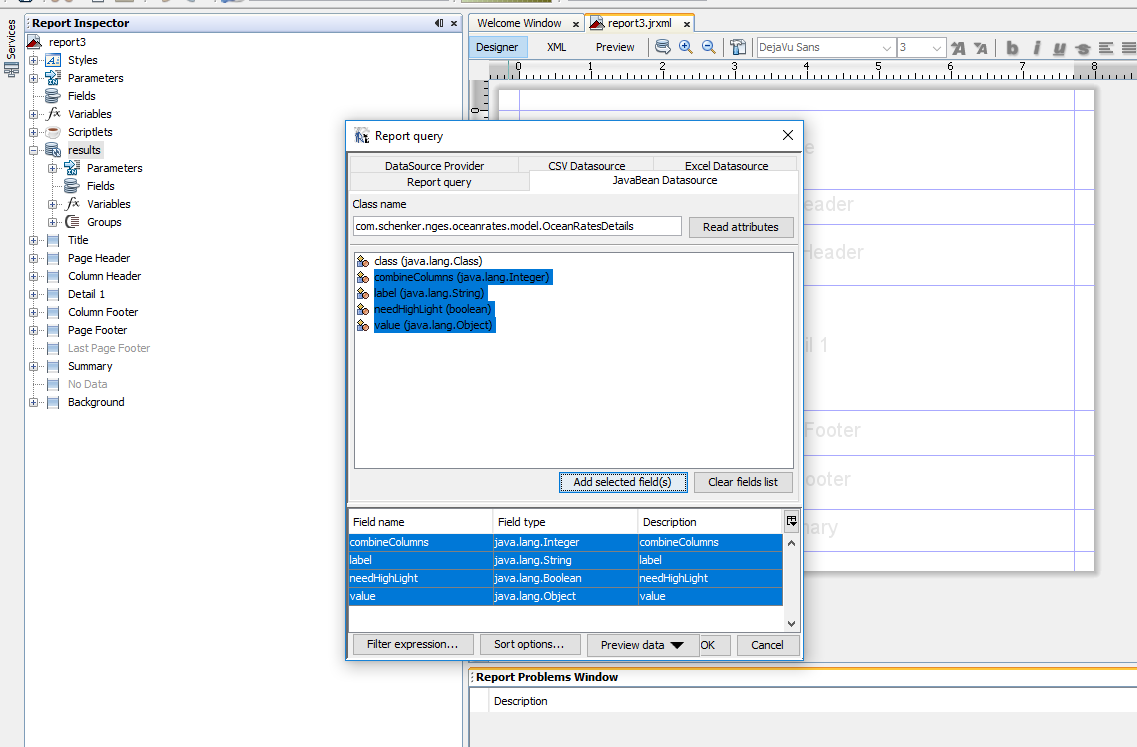
点击Add Datasource,这里命名为results,右击results-->report query-->JavaBean Datasource-->添加自己需要的java对象的路径-->read attribute-->将自己需要的属性选中,add selected fields,这样就可以将所有的数据都加载进来。
5.创建表格
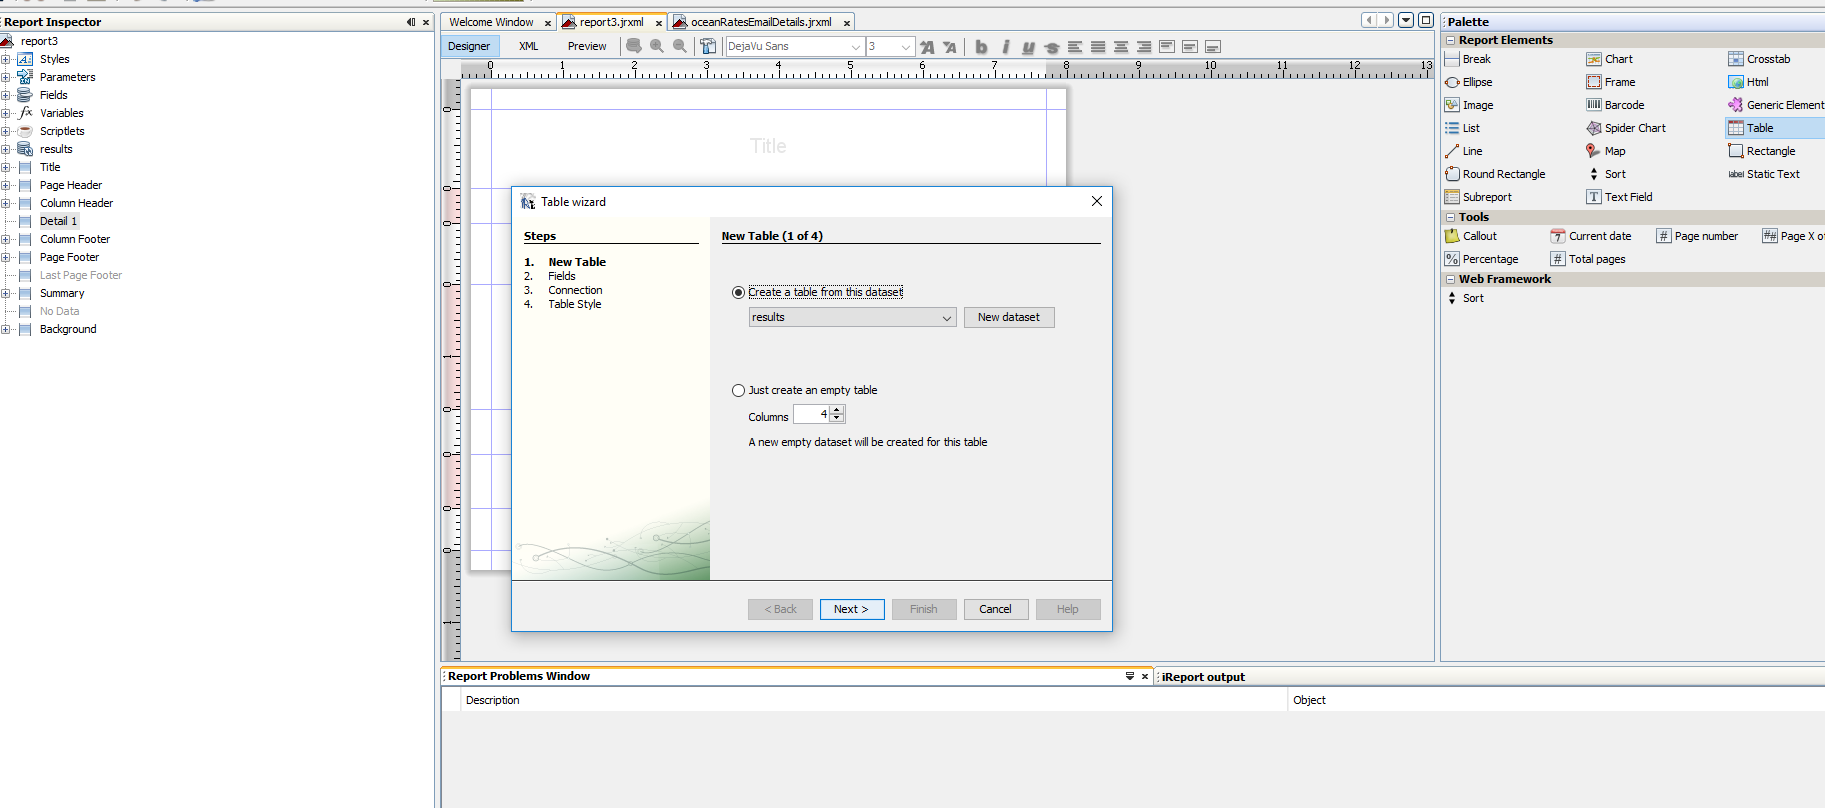
将所有的参数加进来之后,接下来创建一个表格,选择一个dataset,或者是选择具体的column数目。
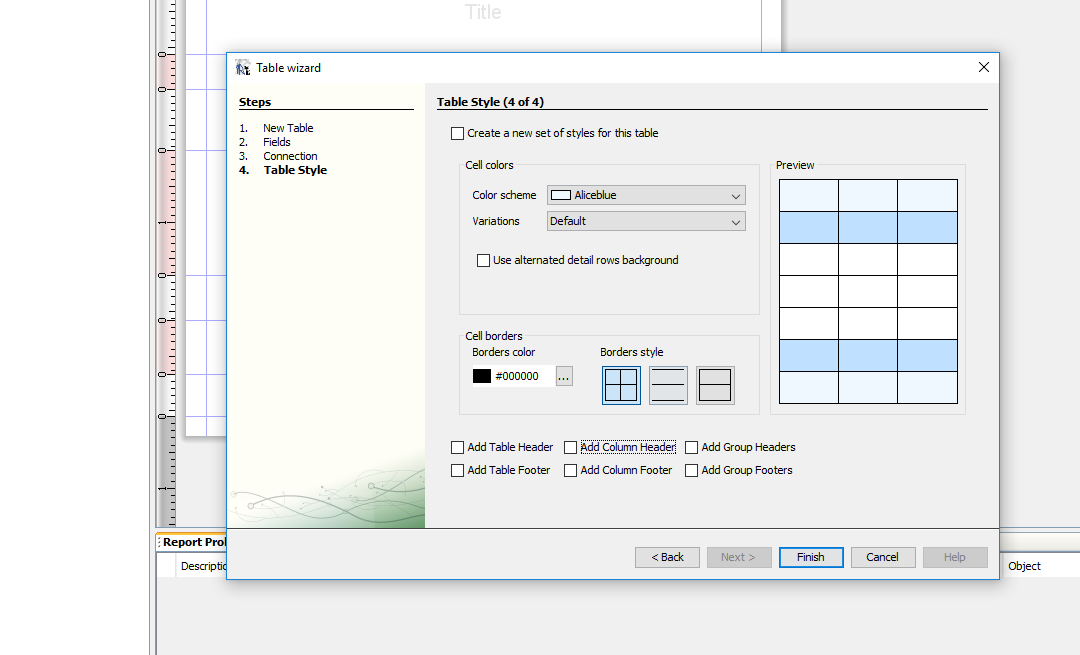
也可以确定table的一些样式,这里什么样式都不添加。
6.表格生成之后指定表格数据的来源。
右击table-->edit table datasource-->指定bean的数据源,sub dataset选择results, express这里指定为:
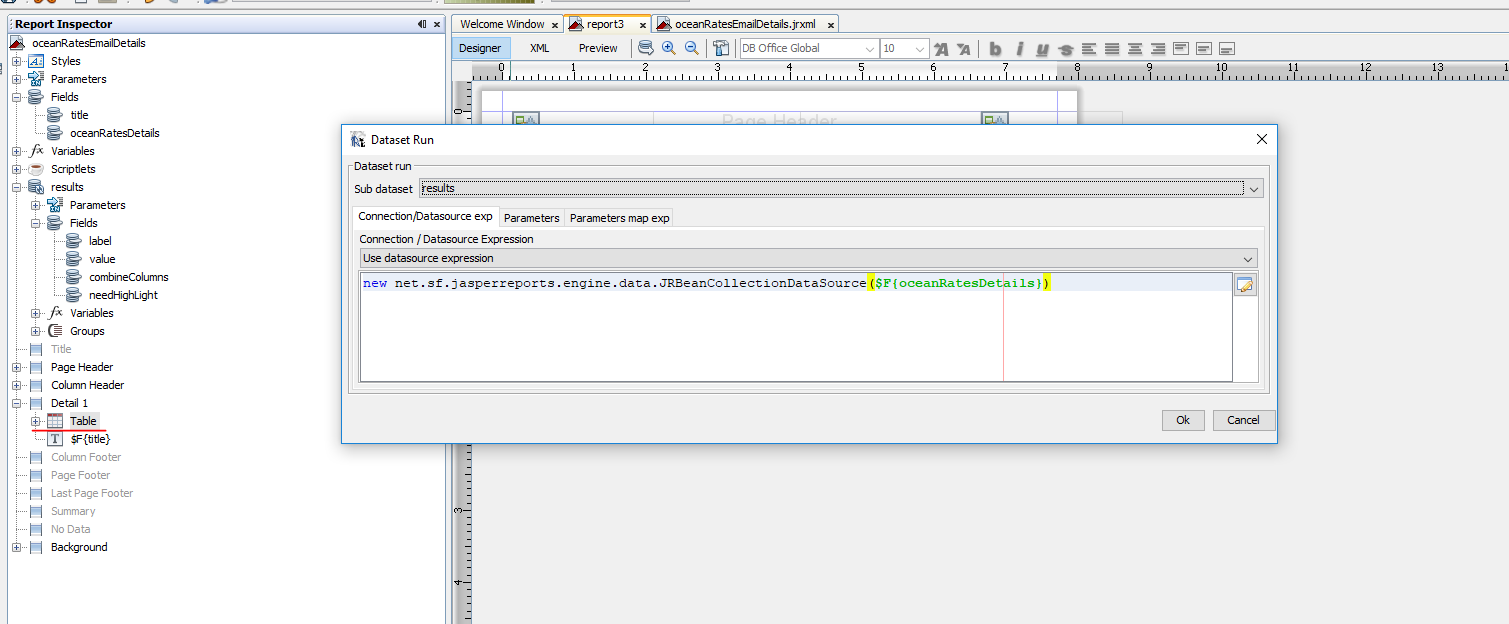
new net.sf.jasperreports.engine.data.JRBeanCollectionDataSource($F{oceanRatesDetails})
表现在xml文件里就是这样一段话:
<datasetRun subDataset="results" uuid="c355b7b5-7454-4ea4-8dd1-e413601ed152">
<dataSourceExpression><![CDATA[new net.sf.jasperreports.engine.data.JRBeanCollectionDataSource($F{oceanRatesDetails})]]></dataSourceExpression>
</datasetRun>
这样的话,也就是实现了表格数据源,不需要上面的第三步。
6.画表格。
这里就涉及到如何切分表格和表格的具体样式。
这里贴一下所有的代码:
<?xml version="1.0" encoding="UTF-8"?> <jasperReport xmlns="http://jasperreports.sourceforge.net/jasperreports" xmlns:xsi="http://www.w3.org/2001/XMLSchema-instance" xsi:schemaLocation="http://jasperreports.sourceforge.net/jasperreports http://jasperreports.sourceforge.net/xsd/jasperreport.xsd" name="oceanRatesEmailDetails" pageWidth="595" pageHeight="842" columnWidth="555" leftMargin="20" rightMargin="20" topMargin="20" bottomMargin="20" uuid="7c39aa93-0bd8-495f-acf2-8c13fccc68d9"> <property name="ireport.zoom" value="1.0"/> <property name="ireport.x" value="0"/> <property name="ireport.y" value="0"/> <subDataset name="details" uuid="8fcf3031-129c-40c1-9d56-37fe078bfce7"> <field name="label" class="java.lang.String"/> <field name="value" class="java.lang.Object"/> <field name="combineColumns" class="java.lang.Integer"/> <field name="needHighLight" class="java.lang.Boolean"/> </subDataset> <parameter name="SUBREPORT_DIR" class="java.lang.String" isForPrompting="false"> <defaultValueExpression><![CDATA[""]]></defaultValueExpression> </parameter> <field name="title" class="java.lang.String"/> <field name="oceanRatesDetails" class="java.util.List"/> <background> <band splitType="Stretch"/> </background> <pageHeader> <band height="28" splitType="Stretch"> <image> <reportElement x="10" y="0" width="142" height="28" uuid="4074945c-59ac-4f4a-a931-f6db80a21f5f"/> <imageExpression><![CDATA[$P{SUBREPORT_DIR} + "DB-SCHENKER_rgb_M.png"]]></imageExpression> </image> <textField> <reportElement x="298" y="0" width="181" height="28" uuid="4bc7d029-9773-48bf-8be1-8af975e2c464"/> <textElement verticalAlignment="Middle"> <font fontName="DB Office Global" size="16"/> </textElement> <textFieldExpression><![CDATA[$R{ocean-rates.slip-sheet-benefit.mail.header.title}]]></textFieldExpression> </textField> <image> <reportElement x="479" y="0" width="142" height="28" uuid="4074945c-59ac-4f4a-a931-f63b80a23f5f"/> <imageExpression><![CDATA[$P{SUBREPORT_DIR} + "oceanFrightSolutions.png"]]></imageExpression> </image> </band> </pageHeader> <columnHeader> <band height="30" splitType="Stretch"> <textField> <reportElement x="10" y="10" width="336" height="20" uuid="7309912c-bd55-41a0-88ec-142f770790eb"/> <textElement> <font fontName="DB Office Global" size="13" isBold="true"/> </textElement> <textFieldExpression><![CDATA[$R{ocean-rates.slip-sheet-benefit.title}]]></textFieldExpression> </textField> </band> </columnHeader> <detail> <band height="125" splitType="Stretch"> <componentElement> <reportElement key="table" mode="Opaque" x="10" y="20" width="650" height="85" uuid="d17eb789-8d34-4619-bc0d-210e5711bbfe"/> <jr:table xmlns:jr="http://jasperreports.sourceforge.net/jasperreports/components" xsi:schemaLocation="http://jasperreports.sourceforge.net/jasperreports/components http://jasperreports.sourceforge.net/xsd/components.xsd"> <datasetRun subDataset="details" uuid="c355b7b5-7454-4ea4-8dd1-e413601ed152"> <dataSourceExpression><![CDATA[new net.sf.jasperreports.engine.data.JRBeanCollectionDataSource($F{oceanRatesDetails})]]></dataSourceExpression> </datasetRun> <jr:column width="300" uuid="2c546703-e51e-456c-8fac-d42cc8fece36"> <jr:detailCell height="20" rowSpan="1"> <textField> <reportElement mode="Opaque" x="0" y="0" width="300" height="20" forecolor="#000000" backcolor="#FFFFFF" uuid="3770bd9e-d595-431a-b0bd-ed6c5813c485"> <printWhenExpression><![CDATA[$F{needHighLight}==false]]></printWhenExpression> </reportElement> <box topPadding="1" leftPadding="2"> <pen lineWidth="0.25"/> <topPen lineWidth="0.25"/> <leftPen lineWidth="0.25"/> <bottomPen lineWidth="0.25"/> <rightPen lineWidth="0.25"/> </box> <textElement> <font fontName="DB Office Global" size="11"/> </textElement> <textFieldExpression><![CDATA[$F{label}]]></textFieldExpression> </textField> <textField> <reportElement mode="Opaque" x="0" y="0" width="300" height="20" forecolor="#FFFFFF" backcolor="#003399" uuid="3770bc9e-d595-431a-b0bd-ed6c5823c485"> <printWhenExpression><![CDATA[$F{needHighLight}==true]]></printWhenExpression> </reportElement> <box topPadding="1" leftPadding="2" rightPadding="0"> <pen lineWidth="0.25" lineColor="#000000"/> <topPen lineWidth="0.25" lineColor="#000000"/> <leftPen lineWidth="0.25" lineColor="#000000"/> <bottomPen lineWidth="0.25" lineColor="#000000"/> <rightPen lineWidth="0.25" lineColor="#000000"/> </box> <textElement> <font fontName="DB Office Global" size="11"/> </textElement> <textFieldExpression><![CDATA[$F{label}]]></textFieldExpression> </textField> </jr:detailCell> </jr:column> <jr:columnGroup width="220" uuid="a51ca014-f035-49d2-bf23-cbb80a4ef5e3"> <jr:column width="220" uuid="e7eb1ec7-cee4-4be2-a9b6-fe572d5629de"> <jr:detailCell height="20"> <textField> <reportElement mode="Opaque" x="0" y="0" width="220" height="20" forecolor="#FFFFFF" backcolor="#003399" uuid="0ab2394e-8a4a-4ca9-af8e-7284795c6e10"> <printWhenExpression><![CDATA[$F{needHighLight}==true && $F{combineColumns}==null]]></printWhenExpression> </reportElement> <box topPadding="1" leftPadding="2"> <pen lineWidth="0.25" lineColor="#000000"/> <topPen lineWidth="0.25" lineColor="#000000"/> <leftPen lineWidth="0.25" lineColor="#000000"/> <bottomPen lineWidth="0.25" lineColor="#000000"/> <rightPen lineWidth="0.25" lineColor="#000000"/> </box> <textElement> <font fontName="DB Office Global" size="11"/> </textElement> <textFieldExpression><![CDATA[""+$F{value}]]></textFieldExpression> </textField> <textField> <reportElement mode="Opaque" x="0" y="0" width="220" height="20" forecolor="#000000" backcolor="#FFFFFF" uuid="0ab2294e-8a4a-4ca9-af8e-7284795c6e20"> <printWhenExpression><![CDATA[$F{needHighLight}==false && $F{combineColumns}==null]]></printWhenExpression> </reportElement> <box topPadding="1" leftPadding="2"> <pen lineWidth="0.25" lineColor="#000000"/> <topPen lineWidth="0.25" lineColor="#000000"/> <leftPen lineWidth="0.25" lineColor="#000000"/> <bottomPen lineWidth="0.25" lineColor="#000000"/> <rightPen lineWidth="0.25" lineColor="#000000"/> </box> <textElement> <font fontName="DB Office Global" size="11"/> </textElement> <textFieldExpression><![CDATA[""+$F{value}]]></textFieldExpression> </textField> <textField> <reportElement mode="Opaque" x="0" y="0" width="220" height="20" forecolor="#FFFFFF" backcolor="#003399" uuid="0ab2394e-8a4a-04c9-af8e-7284795c6e10"> <printWhenExpression><![CDATA[$F{needHighLight}==true && $F{combineColumns}==1]]></printWhenExpression> </reportElement> <box topPadding="1" leftPadding="100"> <pen lineWidth="0.25" lineColor="#000000"/> <topPen lineWidth="0.25" lineColor="#000000"/> <leftPen lineWidth="0.25" lineColor="#000000"/> <bottomPen lineWidth="0.25" lineColor="#000000"/> <rightPen lineWidth="0.25" lineColor="#000000"/> </box> <textElement textAlignment="Center" verticalAlignment="Middle"> <font fontName="DB Office Global" size="11"/> </textElement> <textFieldExpression><![CDATA[""+$F{value}]]></textFieldExpression> </textField> <textField> <reportElement mode="Opaque" x="0" y="0" width="220" height="20" forecolor="#000000" backcolor="#FFFFFF" uuid="ab22944e-8a4a-4ca9-af8e-7384795c6e30"> <printWhenExpression><![CDATA[$F{needHighLight}==false && $F{combineColumns}==1]]></printWhenExpression> </reportElement> <box topPadding="1" leftPadding="100"> <pen lineWidth="0.25" lineColor="#000000"/> <topPen lineWidth="0.25" lineColor="#000000"/> <leftPen lineWidth="0.25" lineColor="#000000"/> <bottomPen lineWidth="0.25" lineColor="#000000"/> <rightPen lineWidth="0.25" lineColor="#000000"/> </box> <textElement textAlignment="Center" verticalAlignment="Middle"> <font fontName="DB Office Global" size="11"/> </textElement> <textFieldExpression><![CDATA[""+$F{value}]]></textFieldExpression> </textField> <textField> <reportElement mode="Opaque" x="0" y="0" width="110" height="20" forecolor="#000000" backcolor="#FFFFFF" uuid="0ab2194e-8a4a-4ca9-af8e-7284795c6e10"> <printWhenExpression><![CDATA[$F{combineColumns}==2]]></printWhenExpression> </reportElement> <box topPadding="1" leftPadding="2"> <pen lineWidth="0.25"/> <topPen lineWidth="0.25"/> <leftPen lineWidth="0.25"/> <bottomPen lineWidth="0.25"/> <rightPen lineWidth="0.25"/> </box> <textElement> <font fontName="DB Office Global" size="11"/> </textElement> <textFieldExpression><![CDATA[""+((ArrayList<Object>)$F{value}).get(0)]]></textFieldExpression> </textField> <textField> <reportElement mode="Opaque" x="110" y="0" width="110" height="20" forecolor="#000000" backcolor="#FFFFFF" uuid="01b82940-8a4a-4cc9-af8e-7284795c6e10"> <printWhenExpression><![CDATA[$F{combineColumns}==2]]></printWhenExpression> </reportElement> <box topPadding="1" leftPadding="2" rightPadding="0"> <pen lineWidth="0.25"/> <topPen lineWidth="0.25"/> <leftPen lineWidth="0.25"/> <bottomPen lineWidth="0.25"/> <rightPen lineWidth="0.25"/> </box> <textElement> <font fontName="DB Office Global" size="11"/> </textElement> <textFieldExpression><![CDATA[""+((ArrayList<Object>)$F{value}).get(1)]]></textFieldExpression> </textField> </jr:detailCell> </jr:column> </jr:columnGroup> </jr:table> </componentElement> <textField> <reportElement mode="Opaque" x="10" y="0" width="545" height="20" uuid="0961c008-c4d9-4673-827d-a2b798f5fd3c"/> <textElement> <font fontName="DB Office Global" size="12"/> </textElement> <textFieldExpression><![CDATA[$F{title}]]></textFieldExpression> </textField> </band> </detail> </jasperReport>
这里有几点需要注意:
<printWhenExpression>用来控制某一列是否出现
forecolor和backcolor控制前景和背景颜色
显示三列还是两列可以通过在同一个<jr:column>里按条件显示不同的列即可
表格的线条通过<box>的linewidth等来控制