封装echarts:
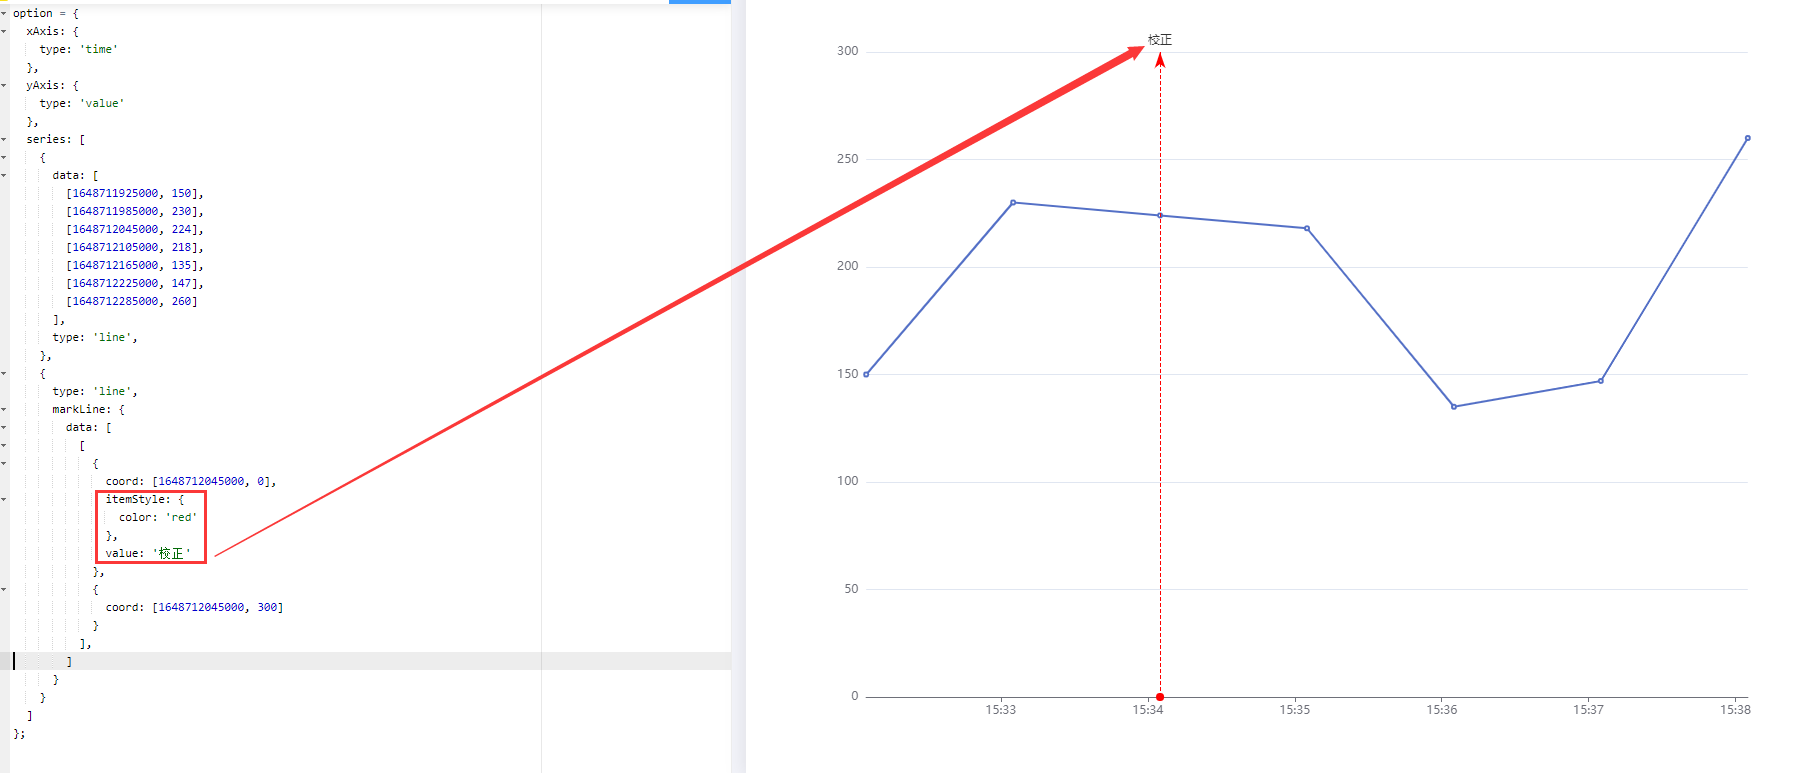
function workOption({
 work_condition_data,
 public_min,
 public_max,
 gauge_min,
 gauge_max,
 work_condition_unit,
 tem_unit,
 title,
 warn_line,
}) {
 let series = []
 let legend = []
 if (work_condition_data && work_condition_data.length) {
  legend = work_condition_data.map(item => item.name)
  work_condition_data.forEach(element => {
   switch (element.name) {
    case '温度':
     series.push({
      type: 'line',
      yAxisIndex: 1,
      name: element.name,
      data: element.data,
      color: element.color,
      animation: false,
     })
     break
    case '轨距':
     series.push({
      type: 'line',
      yAxisIndex: 2,
      name: element.name,
      data: element.data,
      color: element.color,
      animation: false,
     })
     if (element.correction_line && element.correction_line.length) {
      let line_style = correctionLine(element.correction_line, element.name)
      series.push(line_style)
     }
     break
    default:
     series.push({
      type: 'line',
      name: element.name,
      data: element.data,
      color: element.color,
      animation: false,
     })
     if (element.correction_line && element.correction_line.length) {
      let line_style = correctionLine(element.correction_line)
      series.push(line_style)
     }
     break
   }
  })
 }
 // 是否有标识线
 if (warn_line) {
  let line_style = warnLine(warn_line)
  series.push(line_style)
 }

 let option = {
  title: {
   top: '3%',
   left: '12%',
   text: title,
  },
  legend: {
   selectedMode: false,
   data: legend,
  },
  dataZoom: [
   {
    type: 'slider',
    filterMode: 'filter',
    height: 20,
   },
   {
    type: 'inside',
    filterMode: 'filter',
   },
  ],
  tooltip: {
   trigger: 'axis',
   axisPointer: {
    label: {
     show: true,
     color: '#409EFF',
     backgroundColor: 'rgba(255,255,255,1)',
     shadowBlur: 0,
     margin: 3,
    },
    type: 'line',
    lineStyle: {
     color: '#CFD6E1',
     type: 'solid',
      1,
    },
   },
  },
  xAxis: {
   type: 'time',
  },
  yAxis: [
   {
    type: 'value',
    name: `单位:${work_condition_unit}`,
    min: public_min,
    max: public_max,
    axisLine: {
     show: true,
     symbol: ['none', 'none'], // 添加箭头
     lineStyle: {
      color: 'black',
     },
    },
    splitLine: {
     show: true,
     lineStyle: {
      color: '#CFD6E1',
      type: 'solid',
     },
    },
    axisLabel: {
     show: true,
     color: 'black',
    },
    axisTick: {
     show: true,
    },
   },
   {
    // 温度
    type: 'value',
    position: 'right',
    name: `单位:${tem_unit}`,
    axisLine: {
     show: true,
     symbol: ['none', 'none'], // 添加箭头
     lineStyle: {
      color: 'black',
     },
    },
    splitLine: {
     show: false,
     lineStyle: {
      color: '#CFD6E1',
      type: 'dashed',
     },
    },
    axisLabel: {
     show: true,
     color: 'black',
    },
    axisTick: {
     show: true,
    },
   },
   {
    //  轨距
    type: 'value',
    position: 'left',
    name: `轨距`,
    min: gauge_min,
    max: gauge_max,
    offset: 70,
    axisLine: {
     show: true,
     symbol: ['none', 'none'], // 添加箭头
     lineStyle: {
      color: 'black',
     },
    },
    splitLine: {
     show: false,
     lineStyle: {
      color: '#CFD6E1',
      type: 'dashed',
     },
    },
    axisLabel: {
     show: true,
     color: 'black',
    },
    axisTick: {
     show: true,
    },
   },
  ],
  series: series,
 }
 return option
}

// 获取校正线
function correctionLine(line, name) {
 let line_data = []
 let yAxisIndex = 0
 if (name) {
  yAxisIndex = 2
 }
 line.forEach(element => {
  line_data.push([
   {
    coord: element.start,
    itemStyle: {
     color: 'red',
    },
    value: '校正',
   },
   {
    coord: element.end,
   },
  ])
 })
 return {
  type: 'line',
  yAxisIndex: yAxisIndex,
  markLine: {
   data: line_data,
   animation: false,
  },
 }
}

// 获取标识线的配置
function warnLine(data) {
 let markLine_data = []
 let markPoint_data = []
 let yAxisIndex = 0
 if (data.length && data[0].name == '轨距') {
  yAxisIndex = 2
 }
 // 标识线样式
 let postion = '' // 预警线的位置
 data.forEach(element => {
  markLine_data.push({
   yAxis: element.value,
   lineStyle: { type: 'dashed',  1, color: element.color },
   label: { show: false },
  })
  //   postion = element.name.includes('扳动') ? '96%' : '8%'
  postion = '96%'
  markPoint_data.push({
   yAxis: element.value,
   x: postion,
   symbolSize: 0.1,
   label: {
    color: element.color,
    fontSize: 12,
    position: 'left',
    formatter: `${element.label}(${element.value})`,
   },
  })
 })
 // 标识线
 let line_style = {
  type: 'line',
  lineStyle: {  1 },
  yAxisIndex: yAxisIndex,
  showSymbol: false,
  markLine: {
   symbol: ['none', 'arrow'],
   silent: true,
   label: { position: 'start' },
   data: markLine_data,
   animation: false,
  },
  markPoint: {
   silent: true,
   data: markPoint_data,
   animation: false,
  },
 }
 return line_style
}

export default workOption