1、掌握DataFrame数据结构的创建和基本性质。
2、掌握Pandas库的数值运算和统计分析方法。
3、掌握DataFrame缺失值处理、数据集合并等操作。
4、掌握DataFrame累计与分组操作。
5、用eval和query实现更高效的计算。
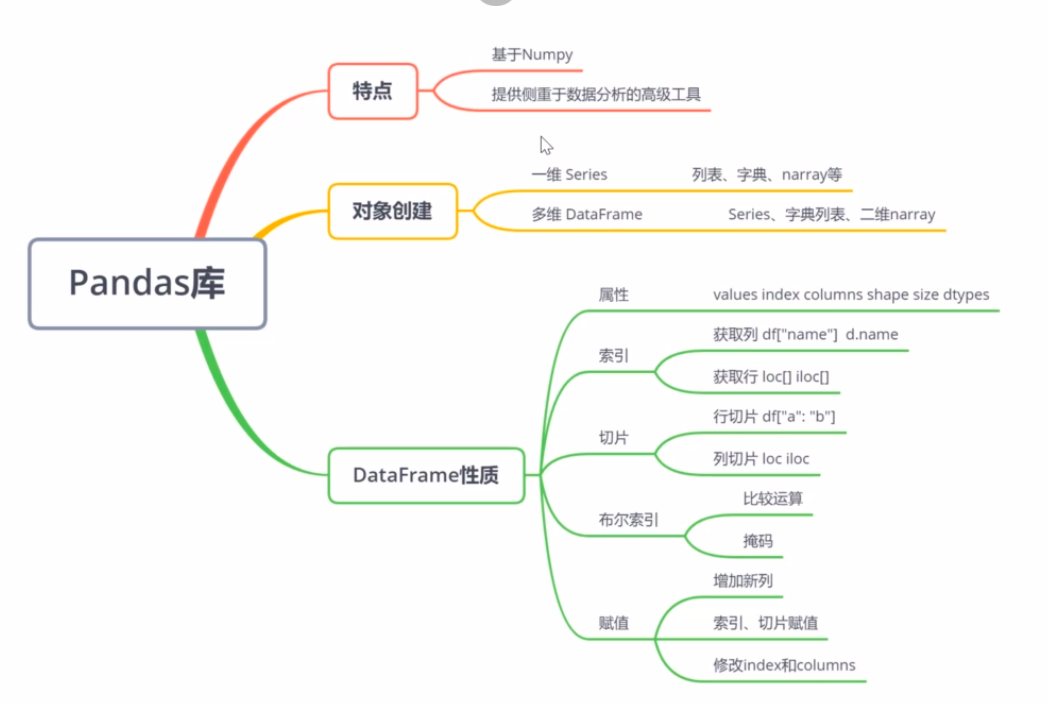
numpy的表现已经很好了,但是当我们需要处理更灵活的数据任务的时候(如为数据添加标签、 处理缺失值、分组等),numpy 的限制就非常明显了,基于numpy而创建的pandas 库提供了一种高效的带行标签和列标签的数据结构DataFrame,完美的解决了上述问题。`
对象创建
Pandas Series对象
Series是带标签数据的一维数组
Series对象的创建
通用结构:pd.Series(data, index=index,dtype=dtype)
-data:数据,可以是列表、字典或Numpy数组
- index:索引,为可选参数
- dtype:数据类型,为可选参数
1、用列表创建
- index缺省时,默认为整数序列
import pandas as pd

data = pd.Series([1.5, 3, 4.5, 6])
print(data)
"""
0    1.5
1    3.0
2    4.5
3    6.0
dtype: float64
"""
# 添加index,数据类型若缺省,则会自动根据传入的数据判断
x = pd.Series([1.5, 3, 4.5, 6], index=["a", "b", "c", "d"])
print(x)
"""
a    1.5
b    3.0
c    4.5
d    6.0
dtype: float64
"""
注意:①数据支持多种数据类型 ②数据类型可被强制改变
2、用一维numpy数组创建
import numpy as np
import pandas as pd

x = np.arange(5)
pd.Series(x)
3、用字典创建
- 默认以键为index,值为data:pd.Series(dict)
import pandas as pd

poplation_dict = {"BeiJing": 1234,
                  "ShangHai": 2424,
                  "ShenZhen": 1303,
                  "HangZhou": 981}
pop1 = pd.Series(poplation_dict)
print(pop1)
"""
BeiJing     1234
ShangHai    2424
ShenZhen    1303
dtype: int64
"""
pop2 = pd.Series(poplation_dict, index=["BeiJing", "HangZhou", "c", "d"])
print(pop2)
"""
BeiJing     1234.0
HangZhou     981.0
c              NaN
d              NaN
dtype: float64
"""
字典创建时,如果指定index,则会到字典的键中筛选,找不到的,值则为NaN
4、data为标量
import pandas as pd

p = pd.Series(5, index=[100, 200, 300])
print(p)
"""
100    5
200    5
300    5
dtype: int64
"""
Pandas DataFrame对象
DataFrame是带标签数据的多维数组
DataFrame对象的创建
通用结构:pd.DataFrame(data, index=index, columns=columns)
- data:数据,可以为列表、字典或Numpy数组
- index:索引,为可选参数
- columns:列标签,为可选参数
1、通过Series对象创建
import pandas as pd

poplation_dict = {"BeiJing": 1234,
                  "ShangHai": 2424,
                  "ShenZhen": 1303,
                  "HangZhou": 981}
pop = pd.Series(poplation_dict)
p = pd.DataFrame(pop)
print(p)
"""
             0
BeiJing   1234
ShangHai  2424
ShenZhen  1303
HangZhou   981
"""
p = pd.DataFrame(pop, columns=["population"])
print(p)
"""
          population
BeiJing         1234
ShangHai        2424
ShenZhen        1303
HangZhou         981
"""
2、通过Series对象字典创建
注意:数量不够的会自动补齐
import pandas as pd

poplation_dict = {"BeiJing": 1234,
                  "ShangHai": 2424,
                  "ShenZhen": 1303,
                  "HangZhou": 981}
GDP_dict = {"BeiJing": 1334,
            "ShangHai": 3424,
            "ShenZhen": 5303,
            "HangZhou": 9681}
pop = pd.Series(poplation_dict)
gdp = pd.Series(GDP_dict)
p = pd.DataFrame({"population": pop,
                  "GDP": gdp,
                "country": "china"})
print(p)
"""
                population   GDP country
BeiJing         1234  1334   China
ShangHai        2424  3424   China
ShenZhen        1303  5303   China
HangZhou         981  9681   China
"""
3、通过字典列表对象创建
- 字典索引作为index,字典键作为columns
- 不存在的键,会默认为NaN
import pandas as pd

data = [{"a": i, "b": 2*i} for i in range(3)]
p = pd.DataFrame(data)

d1 = [{"a": 1, "b": 1}, {"b": 3, "c": 4}]
p1 = pd.DataFrame(d1)
print(p)
print(p1)
"""
a  b
0  0  0
1  1  2
2  2  4
     a  b    c
0  1.0  1  NaN
1  NaN  3  4.0
"""
4、通过Numpy二维数组创建
import numpy as np
import pandas as pd

p = pd.DataFrame(np.random.randint(10, size=(3, 2)), columns=["foo", "bat"], index=["a", "b", "c"])
print(p)
"""
foo  bat
a    1    3
b    0    3
c    4    6
"""
DataFrame性质
1、属性
- df.values :返回numpy数组表示的数据
- df.index:返回行索引
- df.columns:返回行索引
- df.shape:形状
- pd.size:大小
- pd.dtypes:返回每列数据类型
2、索引
(1) 获取列
- 字典式:data["列名"]
- 对象属性式:data.列名
(2) 获取行
- 绝对索引:df.loc["index名"]
- 相对索引:df.loc[index名所对应的索引]
(3) 获取标量:df.loc["index名", "列名"]
(4) Series对象的索引:Series对象名["index名"]
3、切片
import numpy as np
import pandas as pd

dates = pd.date_range(start="2019-01-01", periods=6)
print(dates)
df = pd.DataFrame(np.random.randn(6, 4), index=dates, columns=["A", "B", "C", "D"])
print(df)
"""
DatetimeIndex(['2019-01-01', '2019-01-02', '2019-01-03', '2019-01-04',
               '2019-01-05', '2019-01-06'],
              dtype='datetime64[ns]', freq='D')

                   A         B         C         D
2019-01-01  0.650976  0.195642  0.373875  0.577994
2019-01-02  1.668273 -0.437919  0.107213  2.076671
2019-01-03 -0.969602  0.264837 -0.622912 -1.233762
2019-01-04  0.893448 -0.361137 -2.014520  0.418288
2019-01-05 -1.844135 -0.933371  0.412862 -1.228276
2019-01-06 -0.406997 -0.447221  2.063793 -0.914721
"""
(1) 行切片
print(df["2019-01-01": "2019-01-03"])
print(df.loc["2019-01-01": "2019-01-03"])
print(df.loc[0: 3])    # 相对索引,取0,1,2
"""
                   A         B         C         D
2019-01-01  0.708338 -0.534477  0.409186 -1.046577
2019-01-02 -0.425397  0.050827 -1.136897 -0.120209
2019-01-03  0.191192  0.862435  0.928217  1.448118
                   A         B         C         D
2019-01-01  0.708338 -0.534477  0.409186 -1.046577
2019-01-02 -0.425397  0.050827 -1.136897 -0.120209
2019-01-03  0.191192  0.862435  0.928217  1.448118
"""
(2) 列切片
print(df.loc[:, "A": "C"])
print(df.iloc[:, 0: 3])
"""
                   A         B         C
2019-01-01 -2.569867  0.021640  0.727239
2019-01-02  0.758475  0.209617  0.941152
2019-01-03  0.002097 -0.765052 -0.901855
2019-01-04 -0.209430  0.825318 -0.334309
2019-01-05  0.522325 -2.312552 -0.384917
2019-01-06  1.301911 -0.833983  0.874232
                   A         B         C
2019-01-01 -2.569867  0.021640  0.727239
2019-01-02  0.758475  0.209617  0.941152
2019-01-03  0.002097 -0.765052 -0.901855
2019-01-04 -0.209430  0.825318 -0.334309
"""
(3) 多种多样的取值
- 行、列同时切片:df.loc["2019-01-02": "2019-01-03", "C": "D"]
- 行切片、列分散取值:df.loc["2019-01-04": "2019-01-06", ["A", "C"]]
- 行分散取值、列切片:行分散只能用相对的位置索引进行切片——df.iloc[[1, 5], 0: 3]
- 行、列均分散取值:也只能用相对位置
4、布尔索引——掩码操作
- isin():查询每一行对应列的值是否符合——df["E"].isin(["two", "four"])
5、赋值
import pandas as pd
import numpy as np

dates = pd.date_range(start="2019-01-01", periods=6)
df = pd.DataFrame(np.random.randn(6, 4), index=dates, columns=["A", "B", "C", "D"])
s1 = pd.Series([1, 2, 3, 4, 5, 6], index=pd.date_range("20190101", periods=6))
df["E"] = s1
print(df)   # 增加新列
"""
 A         B         C         D  E
2019-01-01 -0.658733  0.811131 -0.407930  0.176017  1
2019-01-02  1.221720 -1.436906  1.385231 -2.073760  2
2019-01-03  0.337256  0.878561  0.871931  0.816829  3
2019-01-04  0.656371  0.801415 -0.387575 -1.179588  4
2019-01-05 -0.936013  0.892519 -0.073850  0.983318  5
2019-01-06 -1.084148  0.178440 -1.661800  1.042642  6
"""
df.loc["2019-01-01", "A"] = 0   # 等价于df.iloc[0, 1] = 1,修改赋值
# df["D"] = np.array[5]*len(df)   # 可简化为df["D"] = 5
print(df)
"""
A         B         C         D  E
2019-01-01  0.000000 -0.781050  2.360735 -1.409223  1
2019-01-02  0.390676 -1.364522 -0.678399 -0.653149  2
2019-01-03  0.254998  0.402109  0.982087 -1.918915  3
2019-01-04 -1.498213  0.777009 -1.382488 -0.586266  4
2019-01-05  0.167791 -0.642785 -2.081390 -0.532108  5
2019-01-06  0.463543 -1.630412 -1.603518  1.018081  6
"""
"""修改index和columns"""
df.index = [i for i in range(len(df))]
df.columns = [i for i in range(df.shape[1])]
print(df)
"""
  0         1         2         3  4
0  0.000000 -1.111451  1.206426 -1.584109  1
1 -0.971625 -0.399996  0.311155 -0.713528  2
2 -1.085063  0.020041 -0.300341  0.804175  3
3 -0.426142  0.061551 -0.620271 -0.003336  4
4 -1.501278 -0.134365 -0.384964 -0.502363  5
5  0.648978  0.896500 -1.167059  0.589095  6
"""
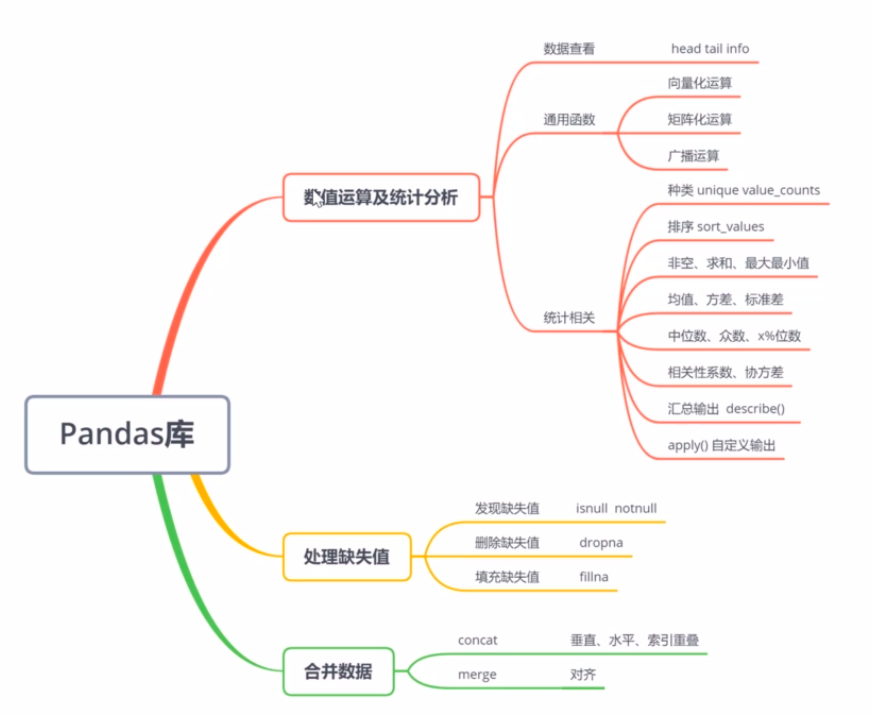
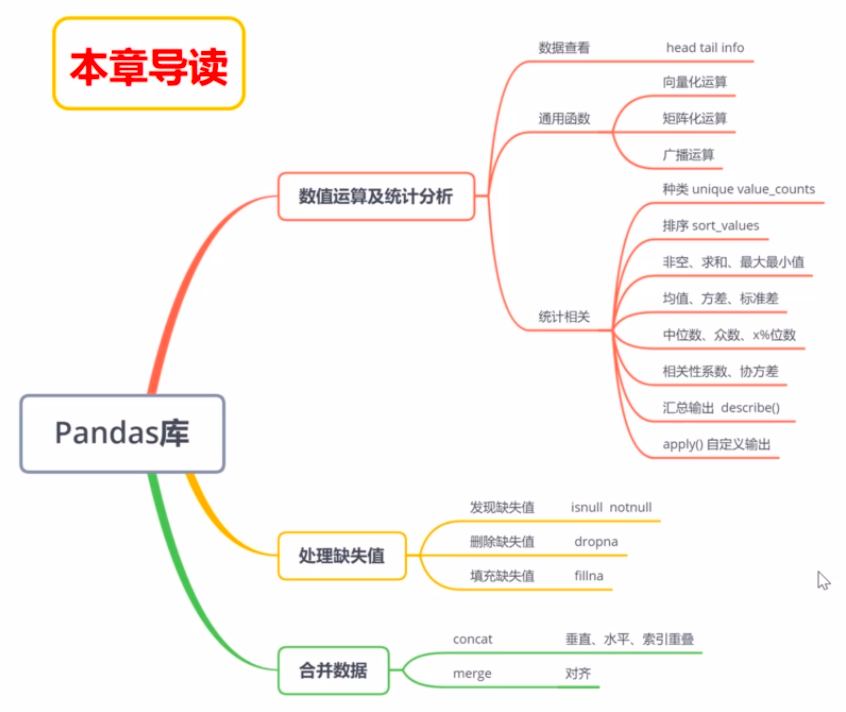
数值运算及统计分析
数据的查看
import pandas as pd
import numpy as np

dates = pd.date_range(start="2019-01-01", periods=6)
df = pd.DataFrame(np.random.randn(6, 4), index=dates, columns=["A", "B", "C", "D"])
"""查看前面的行"""
df.head()   # 默认5行
df.head(2)
"""查看后面的行"""
df.tail()   # 默认5行
df.tail(3)
"""查看总体信息"""
df.info()
Numpy通用函数同样适用于Pandas
- (1) 向量化运算
- (2) 矩阵化运算
- (3) 广播运算:①按行广播 ②按列广播
3、新的用法
(1) 索引对齐
- pandas会自动对齐两个的索引,没有的值用np.nan表示
- 缺省值也可用fill_value来填充:a.add(B, fill_value=0)——直接用运算符,不能填充Nan处
(2) 统计相关
- 数据种类统计
一般来说,纯粹的计算在Numpy里执行的更快:Numpy更侧重在于计算,Pandas侧重于数据处理
import pandas as pd
import numpy as np
from collections import Counter

y = np.random.randint(3, size=20)
print(y)
"""
[0 1 0 1 2 1 2 0 2 1 2 1 0 2 1 0 0 1 1 1]
"""
print(np.unique(y))
"""
[0 1 2]
"""
print(Counter(y))
"""
Counter({1: 9, 0: 6, 2: 5})
"""
y1 = pd.DataFrame(y, columns=["A"])
print(y1)
"""
    A
0   0
1   0
2   2
3   1
4   0
5   0
6   1
7   1
8   0
9   2
10  0
11  2
12  0
13  0
14  2
15  2
16  0
17  1
18  2
19  0
"""
print(np.unique(y1))    # [0 1 2]
print(y1["A"].value_counts())
"""
2    10
0     7
1     3
Name: A, dtype: int64
"""
- 产生新的结果,并进行排序:① city_info.sort_values(by="per_GDP") ① city_info.sort_values(by="per_GDP", ascending=False)
- 行排序:data.sort_index()
- 列排序:data.sort_index(axis=1, ascending=False)
- 非空个数 :df.count()
- 求和:df.sum() df.sum(axis=1)
- 最小值、最大值:df.min() df.max(axis=1) df.idxmax()#坐标
- 均值:df.mean() df.var()
- 中位数:df.median()
- 标准差:df.std()
- 众数:data.mode()
- 75%分位数:df.quantile(0.75)
- 一网打尽:df.describe()
- 相关性系数和协方差:① df.corr() ②df.corrwith(df["A"]) # 某一列的相关信息
- 自定义输出:apply(method)——使用method方法默认对每一列进行相应的操作
df.apply(lambda x: x.max()-x.min())
缺失值处理
- 1、发现缺失值:有None、字符串等,数据类型全部变为object,它比int和float更消耗资源
注意:np.nan是一种特殊的浮点数 - 2、删除缺失值:①删除整行:data.dropna() ②删除整列:data.dropna(axis="columns", how="all | any")
- 3、填充缺失值:①用均值进行替换:data.fillna(value=5) ②用均值进行替换:data.fillna(value=data.mean())
合并数据
import pandas as pd

"""构造一个生产DataFrame函数"""
def make_df(cols, ind):
    data = {c: [str(c)+str(i) for i in ind] for c in cols}
    return pd.DataFrame(data, ind)

df_1 = make_df("AB", [1, 2])
df_2 = make_df("AB", [3, 4])
print(df_1)
print(df_2)
"""
 A   B
1  A1  B1
2  A2  B2
    A   B
3  A3  B3
4  A4  B4
"""
"""垂直合并"""
pd_v = pd.concat([df_1, df_2])
print(pd_v)
"""
A   B
1  A1  B1
2  A2  B2
3  A3  B3
4  A4  B4
"""
"""水平合并"""
df_3 = make_df("CD", [1, 2])
pd_h = pd.concat([df_1, df_3], axis=1)
print(pd_h)
"""
    A   B   C   D
1  A1  B1  C1  D1
2  A2  B2  C2  D2
"""
"""行重叠"""
df_5 = make_df("AB", [1, 2])
df_6 = make_df("AB", [1, 2])
print(pd.concat([df_5, df_6], ignore_index=True))
"""
A   B
0  A1  B1
1  A2  B2
2  A1  B1
3  A2  B2
"""
"""对齐合并merge()"""
df_9 = make_df("AB", [1, 2])
df_10 = make_df("BC", [1, 2])
print(pd.merge(df_9, df_10))
"""
  A   B   C
0  A1  B1  C1
1  A2  B2  C2
"""
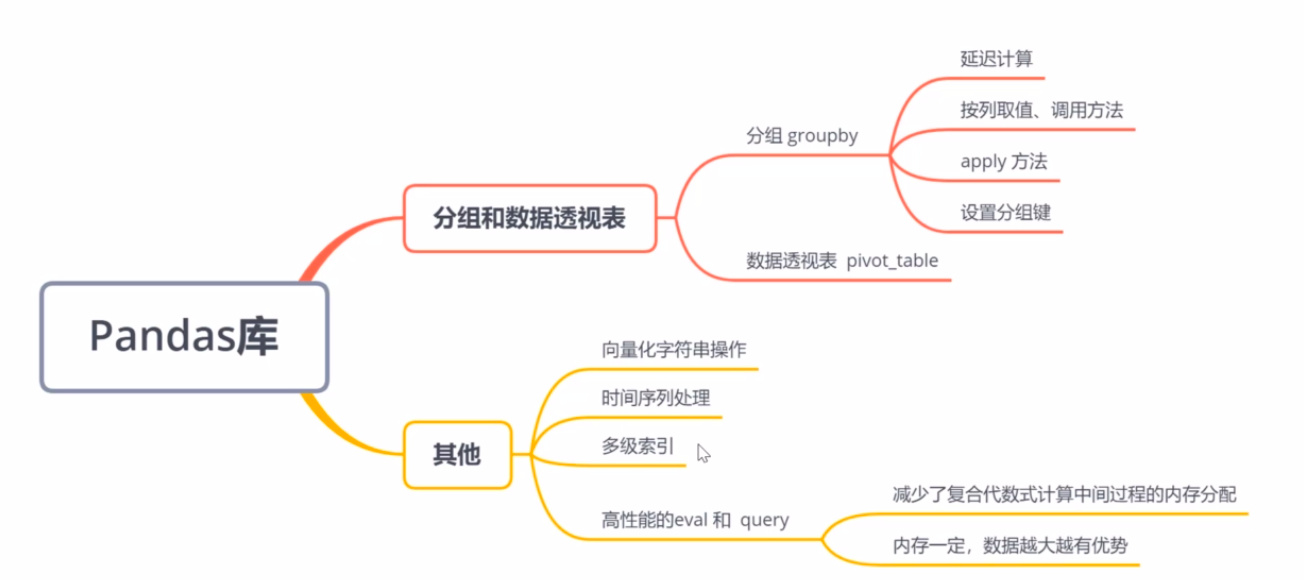
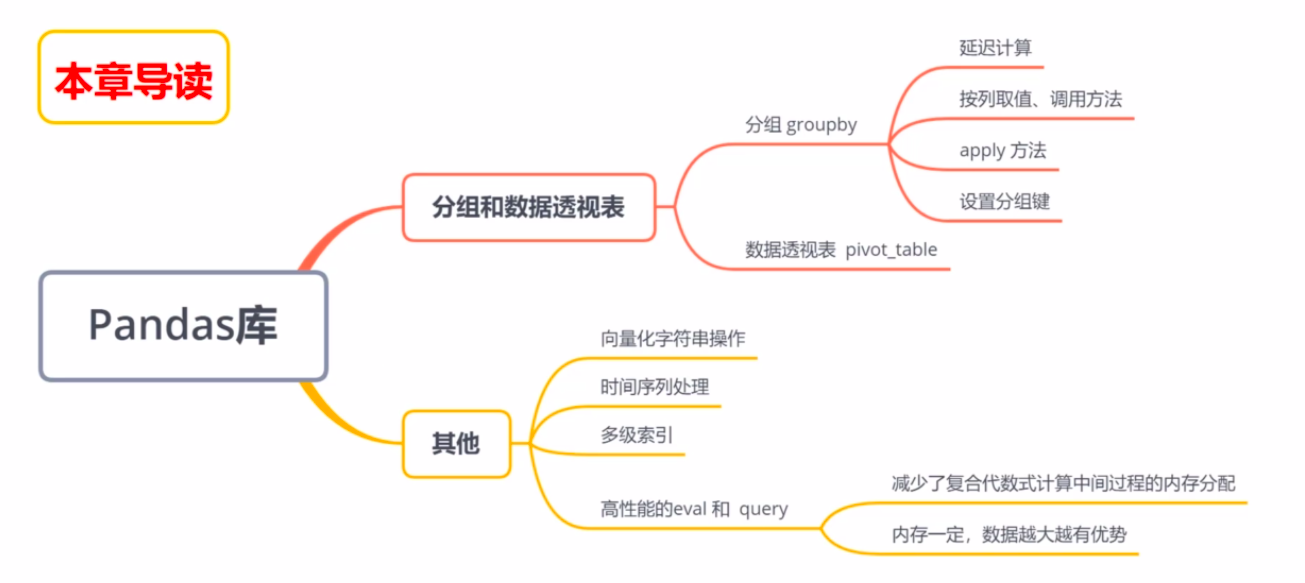
分组和数据透视表
(1) 分组
- 延迟计算:df.groupby("key") df.groupby("key").sum()
for i in df.groupby("key"):
    print(str(i))
- 按列取值: df.groupby("key")["data2"].sum()
- 按组迭代
for data, group in df.groupby("key"):
    print("{0:5} shape={1}".format(data, group.shape))
- 过滤:df.groupby("key").filter(filter_func)
- 转换:df.groupby("key").transform(lambda x: x-x.mean())
- apply():
- 用字典将索引映射到分组
[[]]:dataframe类型
[]:Series类型
数据透视表:数据集.pivot_table("需要查询列的名", index="index名", columns="class")
其他
- (1) 向量化字符串操作
- (2) 处理时间序列
- (3) 多级索引:用于多维数据
高性能的Pandas:eval()
减少了复合代数式在计算中间过程的内存分配
高性能的Pandas:query()
当处理小数组时,普通方法反而更快
