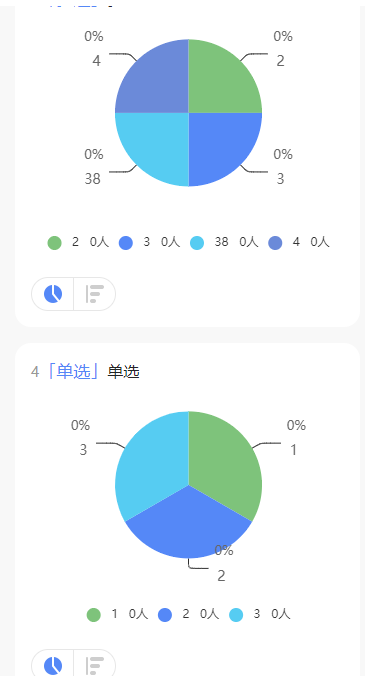
说明:第一次使用echarts在微信小程序中,且需要循环渲染,因官网中并没有提供方法,着实头疼了很久。好在实现了,在此做下记录。
思路:循环渲染,需要动态的数据传入,隐藏可在ec-canvas.js文件的 init方法中,设置一个动态的data参数,循环渲染即可
1.将下载的echarts包,载入到json文件中,路径根据自身情况载入即可
"usingComponents": {
    "ec-canvas": "../../../ec-canvas/ec-canvas"
  },
2.找到下载的echarts包中,ec-canvas.js文件,对其添加data参数
首先,找到改文件中接收的参数设置对象properties,新增要添加的data参数,在此将其命名为 tudata。
 properties: {
    canvasId: {
      type: String,
      value: 'ec-canvas'
    },

    ec: {
      type: Object
    },
    tuData:{//这是新增的参数
      type: Object
    },
    forceUseOldCanvas: {
      type: Boolean,
      value: false
    }
  },
然后,将该参数传入方法中,(由于版本不同,方法可能不一样,但是,大致是差不多的,只需在使用(或者设置)参数的地方,将新增的参数添加上去即可。height,width,这两个是必传参数,凡是同时设置这两个参数的地方都将tudata添加上去即可)
methods: {
    init: function (callback) {
      const version = wx.getSystemInfoSync().SDKVersion

      const canUseNewCanvas = compareVersion(version, '2.9.0') >= 0;
      const forceUseOldCanvas = this.data.forceUseOldCanvas;
      const isUseNewCanvas = canUseNewCanvas && !forceUseOldCanvas;
      this.setData({ isUseNewCanvas });

      if (forceUseOldCanvas && canUseNewCanvas) {
        console.warn('开发者强制使用旧canvas,建议关闭');
      }

      if (isUseNewCanvas) {
        // console.log('微信基础库版本大于2.9.0,开始使用<canvas type="2d"/>');
        // 2.9.0 可以使用 <canvas type="2d"></canvas>
        this.initByNewWay(callback);
      } else {
        const isValid = compareVersion(version, '1.9.91') >= 0
        if (!isValid) {
          console.error('微信基础库版本过低,需大于等于 1.9.91。'
            + '参见:https://github.com/ecomfe/echarts-for-weixin'
            + '#%E5%BE%AE%E4%BF%A1%E7%89%88%E6%9C%AC%E8%A6%81%E6%B1%82');
          return;
        } else {
          console.warn('建议将微信基础库调整大于等于2.9.0版本。升级后绘图将有更好性能');
          this.initByOldWay(callback);
        }
      }
    },

    initByOldWay(callback) {
      // 1.9.91 <= version < 2.9.0:原来的方式初始化
      ctx = wx.createCanvasContext(this.data.canvasId, this);
      const canvas = new WxCanvas(ctx, this.data.canvasId, false);

      echarts.setCanvasCreator(() => {
        return canvas;
      });
      // const canvasDpr = wx.getSystemInfoSync().pixelRatio // 微信旧的canvas不能传入dpr
      const canvasDpr = 1
      var query = wx.createSelectorQuery().in(this);
      query.select('.ec-canvas').boundingClientRect(res => {
        if (typeof callback === 'function') {  //新增动态data参数 回调函数中,需要添加tudata
          this.chart = callback(canvas, res.width, res.height, this.data.tuData,canvasDpr);
        }
        else if (this.data.ec && typeof this.data.ec.onInit === 'function') {   //新增this.data.tuData 用于动态赋值data
          this.chart = this.data.ec.onInit(canvas, res.width, res.height, this.data.tuData,canvasDpr);
        }
        else {
          this.triggerEvent('init', {
            canvas: canvas,
             res.width,
            height: res.height,
            tuData:this.data.tuData,  //新增data 参数
            canvasDpr: canvasDpr // 增加了dpr,可方便外面echarts.init
          });
        }
      }).exec();
    },

    initByNewWay(callback) {
      // version >= 2.9.0:使用新的方式初始化
      const query = wx.createSelectorQuery().in(this)
      query
        .select('.ec-canvas')
        .fields({ node: true, size: true })
        .exec(res => {
          const canvasNode = res[0].node
          this.canvasNode = canvasNode

          const canvasDpr = wx.getSystemInfoSync().pixelRatio
          const canvasWidth = res[0].width
          const canvasHeight = res[0].height

          const ctx = canvasNode.getContext('2d')

          const canvas = new WxCanvas(ctx, this.data.canvasId, true, canvasNode)
          echarts.setCanvasCreator(() => {
            return canvas
          })

          if (typeof callback === 'function') {
            this.chart = callback(canvas, canvasWidth, canvasHeight,this.data.tuData, canvasDpr)
          } else if (this.data.ec && typeof this.data.ec.onInit === 'function') {
            this.chart = this.data.ec.onInit(canvas, canvasWidth, canvasHeight, this.data.tuData,canvasDpr)
          } else {
            this.triggerEvent('init', {
              canvas: canvas,
               canvasWidth,
              height: canvasHeight,
              tuData:this.data.tuData,  //新增 动态data参数
              dpr: canvasDpr
            })
          }
        })
    },
    canvasToTempFilePath(opt) {
      if (this.data.isUseNewCanvas) {
        // 新版
        const query = wx.createSelectorQuery().in(this)
        query
          .select('.ec-canvas')
          .fields({ node: true, size: true })
          .exec(res => {
            const canvasNode = res[0].node
            opt.canvas = canvasNode
            wx.canvasToTempFilePath(opt)
          })
      } else {
        // 旧的
        if (!opt.canvasId) {
          opt.canvasId = this.data.canvasId;
        }
        ctx.draw(true, () => {
          wx.canvasToTempFilePath(opt, this);
        });
      }
    },

    touchStart(e) {
      if (this.chart && e.touches.length > 0) {
        var touch = e.touches[0];
        var handler = this.chart.getZr().handler;
        handler.dispatch('mousedown', {
          zrX: touch.x,
          zrY: touch.y
        });
        handler.dispatch('mousemove', {
          zrX: touch.x,
          zrY: touch.y
        });
        handler.processGesture(wrapTouch(e), 'start');
      }
    },

    touchMove(e) {
      if (this.chart && e.touches.length > 0) {
        var touch = e.touches[0];
        var handler = this.chart.getZr().handler;
        handler.dispatch('mousemove', {
          zrX: touch.x,
          zrY: touch.y
        });
        handler.processGesture(wrapTouch(e), 'change');
      }
    },

    touchEnd(e) {
      if (this.chart) {
        const touch = e.changedTouches ? e.changedTouches[0] : {};
        var handler = this.chart.getZr().handler;
        handler.dispatch('mouseup', {
          zrX: touch.x,
          zrY: touch.y
        });
        handler.dispatch('click', {
          zrX: touch.x,
          zrY: touch.y
        });
        handler.processGesture(wrapTouch(e), 'end');
      }
    }
  }
3.在wxml中使用。tuData="{{item.data}}" 动态data
<view class="container" wx:for="{{qsList}}" wx:key='*this' wx:for-item="item" wx:for-index="index">
      <ec-canvas id="mychart-dom-bar" canvas-id="mychart-bar" tuData="{{item.data}}" ec="{{ec}}"></ec-canvas>
</view>
4.js中使用
function initChart(canvas, width, height,data) {   //data
  console.log('????成功了嘛--------------',data)
  const chart = echarts.init(canvas, null, {
     width,
    height: height
  });
  canvas.setChart(chart);

  var option = {

      legend: {
          orient: 'horizontal',  //vertical horizontal
          left: 'center',
          bottom: 0,
          icon: 'circle',
          itemGap: 10,
          // formatter: '',
          // 使用回调函数
          formatter: function (name) {  //设为动态 data1 data2
              for(let i of data){
                  if(i.name==name){return i.name + "   " + i.value +'人' }
              }

          }
      },
      series: [
          {
          type: 'pie',
            radius: ['0%', '60%'],
            center: ['50%', '42%'],
            color: ['#7EC37B','#5588F7','#56CCF2','#6B8AD9','#BB6BD9','#EB5757','#F2994A','#F2C94C','#27AE60',],
            label: {
              formatter: '{per|{d}%}
 {b|{b}} ',
              borderColor: 'red',
              color: '#666',
              fontSize: 13,
              rich: {
                a: {
                  color: '#666',
                  lineHeight: 22,
                  align: 'center'
                },
                hr: {
                   '100%',
                  height: 0
                },
                b: {
                  fontSize: 14,
                  lineHeight: 33
                },
                per: {
                  fontSize: 13,
                  color: '#666',
                  padding: [2, 1],
                  borderRadius: 2
                }
              },
            },
            labelLine: {
              lineStyle: {
                color: '#2E2E2E'
              },
              smooth: 0.2,
              length: 10,
              length2: 20
            },
            data: data  //设为动态 data1 data2
          }
      ]
  }
  chart.setOption(option);
  return chart;
}
page({
    data:{
         ec: {   //初始化数据 用于渲染  可动态添加
            onInit: initChart
        },
      qsList:[] ,  //数据集合
} })

