H5实现图表和地图的代码如下:
  1 <!DOCTYPE html>
  2 <html>
  3     <head>
  4         <title>图表和地图</title>
  5         <meta name="viewport" content="width=device-width, initial-scale=1.0, maximum-scale=1.0, minimum-scale=1.0, user-scalable=no" />
  6         <style type="text/css">
  7             html,body{
  8                 100%;
  9                 height:100%;
 10             }
 11             *{
 12                 margin:0px;
 13                 padding:0px;
 14             }
 15             body, button, input, select, textarea {
 16                 font: 12px/16px Verdana, Helvetica, Arial, sans-serif;
 17             }
 18             p{
 19                 603px;
 20                 padding-top:3px;
 21                 overflow:hidden;
 22             }
 23             .btn{
 24                 142px;
 25             }
 26             #container{
 27                 100%;
 28                 height:300px;
 29             }
 30         </style>
 31     </head>
 32     <body>
 33         <div id="main" style=" 100%;height:400px;"></div>
 34         <div id="container"style="margin-bottom: 50px"></div>
 35
 36         <script type="text/javascript" src="asset/js/jquery-2.2.4.js"></script>
 37         <script type="text/javascript" src="asset/js/echarts.min.js"></script>
 38
 39         <script charset="utf-8" src="https://map.qq.com/api/js?v=2.exp&key=IZJBZ-PAUKF-YQOJ6-JM4TR-T3RT5-N6BM5"></script>
 40         <script charset="utf-8" src="https://map.qq.com/api/js?v=2.exp&key=IZJBZ-PAUKF-YQOJ6-JM4TR-T3RT5-N6BM5&libraries=drawing,geometry,place,convertor,visualization"></script>
 41         <script type="text/javascript">
 42         // 基于准备好的dom,初始化echarts实例
 43         var myChart = echarts.init(document.getElementById('main'));
 44         // 指定图表的配置项和数据
 45         myChart.setOption({
 46                 xAxis: {
 47                   type: 'category',
 48                   data: [1,2,3,4,5],
 49                   axisLabel:{
 50                     textStyle:{
 51                       fontSize:8
 52                     }
 53                   }
 54                 },
 55                 yAxis: {
 56                   type: 'value',
 57                   axisLabel:{
 58                     formatter:'{value}℃',
 59                     textStyle:{
 60                       fontSize:8
 61                     }
 62                   }
 63                 },
 64                 series: [
 65                   {
 66                     data: [20,30,50,60,30],
 67                     type: 'line',
 68                     smooth: true,
 69                     symbol: 'none',//去掉小圆点
 70                     itemStyle: {
 71                       normal: {
 72                         color: '#537FE2',
 73                         lineStyle: {
 74                           color: '#537FE2'
 75                         }
 76                       }
 77                     }
 78                   },
 79                   {
 80                     data: [10,10,10,10,10],
 81                     type: 'line',
 82                     smooth: false,
 83                     symbol: 'none',//去掉小圆点
 84                     itemStyle:{
 85                       normal:{
 86                         lineStyle:{
 87                           2,
 88                           type:'dotted',  //'dotted'虚线 'solid'实线
 89                           color:'#2BB4DF'
 90                         }
 91                       }
 92                     }
 93                   },
 94                   {
 95                     data: [60,60,60,60,60],
 96                     type: 'line',
 97                     smooth: false,
 98                     symbol: 'none',//去掉小圆点
 99                     itemStyle:{
100                       normal:{
101                         lineStyle:{
102                           2,
103                           type:'dotted',  //'dotted'虚线 'solid'实线
104                           color:'#2BB4DF'
105                         }
106                       }
107                     }
108                   },
109                 ],
110               })
111       </script>
112       <script>
113         window.onload = function(){
114
115         //直接加载地图
116         //初始化地图函数  自定义函数名init
117         function init() {
118             //定义map变量 调用 qq.maps.Map() 构造函数   获取地图显示容器
119             var map = new qq.maps.Map(document.getElementById("container"), {
120                 center: new qq.maps.LatLng(39.910,116.399),  // 地图的中心地理坐标。
121                 zoom:14//地图的中心地理坐标。
122             });
123
124             var polyline = new qq.maps.Polyline({
125                 path: [
126                     new qq.maps.LatLng(39.915, 116.399),
127                     new qq.maps.LatLng(39.920, 116.389),
128                     new qq.maps.LatLng(39.930, 116.399)
129                 ],
130                 strokeColor: '#000000',
131                 strokeWeight: 2,
132                 map
133             });
134
135             var marker = new qq.maps.Marker({
136                 position: new qq.maps.LatLng(39.920,116.380),
137                 map: map,
138             });
139                var anchor = new qq.maps.Point(0, 39),
140                   size = new qq.maps.Size(42, 68),
141                   origin = new qq.maps.Point(0, 0),
142                   markerIcon = new qq.maps.MarkerImage(
143               "https://3gimg.qq.com/lightmap/api_v2/2/4/99/theme/default/imgs/marker.png",
144               size,
145               origin,
146               anchor
147             );
148             marker.setIcon(markerIcon);
149
150         }
151
152         //调用初始化函数地图
153         init();
154         }
155         </script>
156     </body>
157 </html>
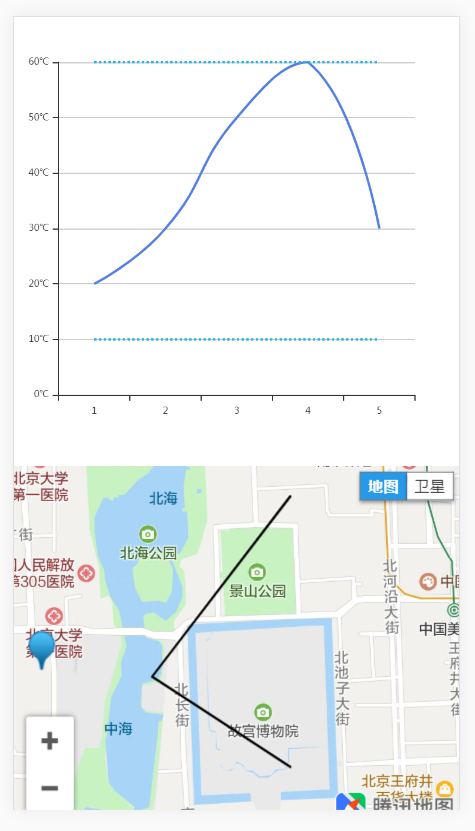
手机端效果图如下:
我们对以上代码进行分析,
图表使用了echarts,引入了echarts.min.js。
地图用的是腾讯地图,引用了线上的两个库。
1 <script charset="utf-8" src="https://map.qq.com/api/js?v=2.exp&key=IZJBZ-PAUKF-YQOJ6-JM4TR-T3RT5-N6BM5"></script>
2 <script charset="utf-8" src="https://map.qq.com/api/js?v=2.exp&key=IZJBZ-PAUKF-YQOJ6-JM4TR-T3RT5-N6BM5&libraries=drawing,geometry,place,convertor,visualization"></script>
图表是折线图,设置好x轴(xAxis)的数据,
1 xAxis: {
2   type: 'category',
3   data: [1,2,3,4,5],
4   axisLabel:{
5     textStyle:{
6       fontSize:8
7     }
8   }
9 },
在formatter里设置y轴的单位,
1 yAxis: {
2   type: 'value',
3   axisLabel:{
4     formatter:'{value}℃',
5     textStyle:{
6       fontSize:8
7     }
8   }
9 },
然后设置y轴(yAxis)的数据。
 1 series: [
 2   {
 3     data: [20,30,50,60,30],
 4     type: 'line',
 5     smooth: true,
 6     symbol: 'none',//去掉小圆点
 7     itemStyle: {
 8       normal: {
 9         color: '#537FE2',
10         lineStyle: {
11           color: '#537FE2'
12         }
13       }
14     }
15   },
16   {
17     data: [10,10,10,10,10],
18     type: 'line',
19     smooth: false,
20     symbol: 'none',//去掉小圆点
21     itemStyle:{
22       normal:{
23         lineStyle:{
24           2,
25           type:'dotted',  //'dotted'虚线 'solid'实线
26           color:'#2BB4DF'
27         }
28       }
29     }
30   },
31   {
32     data: [60,60,60,60,60],
33     type: 'line',
34     smooth: false,
35     symbol: 'none',//去掉小圆点
36     itemStyle:{
37       normal:{
38         lineStyle:{
39           2,
40           type:'dotted',  //'dotted'虚线 'solid'实线
41           color:'#2BB4DF'
42         }
43       }
44     }
45   },
46 ],
可以画出多条折线,并设置颜色、虚实线、是否加上小圆点等状态。
地图则可以设置中心坐标,
1 //定义map变量 调用 qq.maps.Map() 构造函数   获取地图显示容器
2 var map = new qq.maps.Map(document.getElementById("container"), {
3     center: new qq.maps.LatLng(39.910,116.399),  // 地图的中心地理坐标。
4     zoom:14//地图的中心地理坐标。
5 });
并根据多个点的坐标画出路径线(polyline),
 1 var polyline = new qq.maps.Polyline({
 2     path: [
 3         new qq.maps.LatLng(39.915, 116.399),
 4         new qq.maps.LatLng(39.920, 116.389),
 5         new qq.maps.LatLng(39.930, 116.399)
 6     ],
 7     strokeColor: '#000000',
 8     strokeWeight: 2,
 9     map
10 });
然后可以设置标记(marker)的位置和更换标记的图标。
 1 var marker = new qq.maps.Marker({
 2     position: new qq.maps.LatLng(39.920,116.380),
 3     map: map,
 4 });
 5      var anchor = new qq.maps.Point(0, 39),
 6       size = new qq.maps.Size(42, 68),
 7       origin = new qq.maps.Point(0, 0),
 8       markerIcon = new qq.maps.MarkerImage(
 9   "https://3gimg.qq.com/lightmap/api_v2/2/4/99/theme/default/imgs/marker.png",
10   size,
11   origin,
12   anchor
13 );
14 marker.setIcon(markerIcon);